 Ruby
Ruby
 Golang
 .Net
.Net
 MCP
MCP
 C++
C++

We are surrounded by tons of data. But what's the point if we can't understand it all? That's where Google Trends comes in. Google Trends offers valuable insights into what people search for on the internet. Let's dive in and see how we can programmatically scrape Google Trends data using Python, without the PyTrends library.
If you want to scrape Google Trends with other programming languages, or want to see more examples, check out our main scraping Google Trends blog post.
Step-by-step scraping Google Trends data with Python
Without further ado, let's start and collect data from Google Trends.
Step 1: Tools
We'll use the new official Python library by SerpApi: serpapi-python.
That's the only tool that we need!
As a side note: You can use this library to scrape search results from other search engines, not just Google.
Usually, you'll write your DIY solution using PyTrends, BeautifulSoup, Selenium, Scrapy, Requests, etc., to scrape Google Trends results. You can relax now since we perform all these heavy tasks for you. So, you don't need to worry about all the problems you might've encountered while implementing your web scraping solution.
Step 2: Setup and preparation
- Sign up for free at SerpApi. You can get 100 free searches per month.
- Get your SerpApi Api Key from this page.
- Create a new
.envfile, and assign a new env variable with value from API_KEY above.SERPAPI_KEY=$YOUR_SERPAPI_KEY_HERE - Install python-dotenv to read the
.envfile withpip install python-dotenv - Install SerpApi's Python library with
pip install serpapi - Create new
main.pyfile for the main program.
Your folder structure will look like this:
|_ .env
|_ main.py
Step 3: Write the code for scraping Google Trends
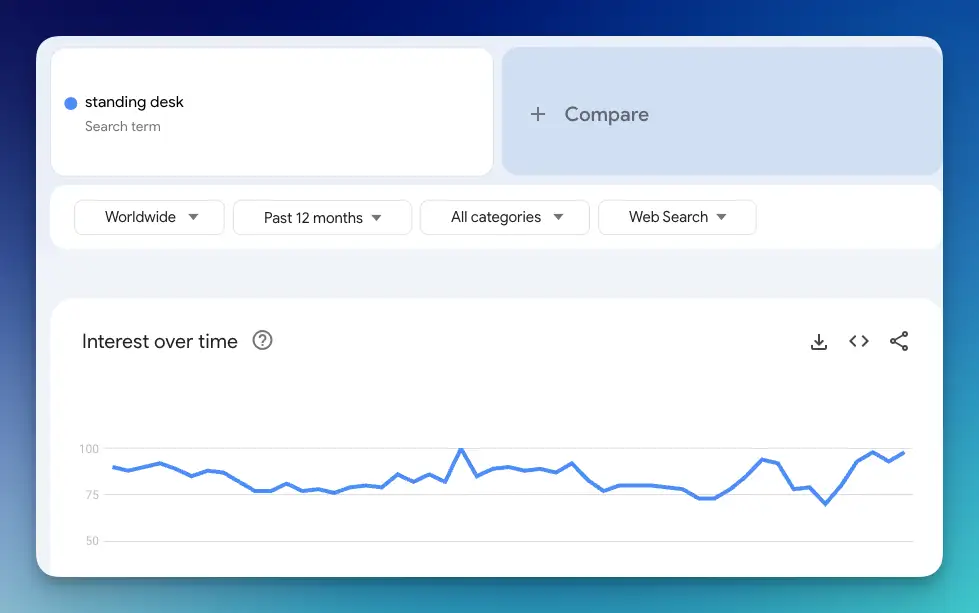
Let's say I want to get this result:
- Keyword: 'standing desk'
- Region: 'worldwide'
- Time: 'Past 12 months'
Here is the Python code:
import os
import serpapi
from dotenv import load_dotenv

load_dotenv()
api_key = os.getenv('SERPAPI_KEY')

client = serpapi.Client(api_key=api_key)
search =  client.search(
    engine="google_trends",
    q="standing desk",
    api_key=api_key,
  )

print(search)
By default, the Google Trends API will set the location for worldwide and duration of the past 12 months . We'll take a look at how to change these values later. For now, let's take a look at our perfect result:
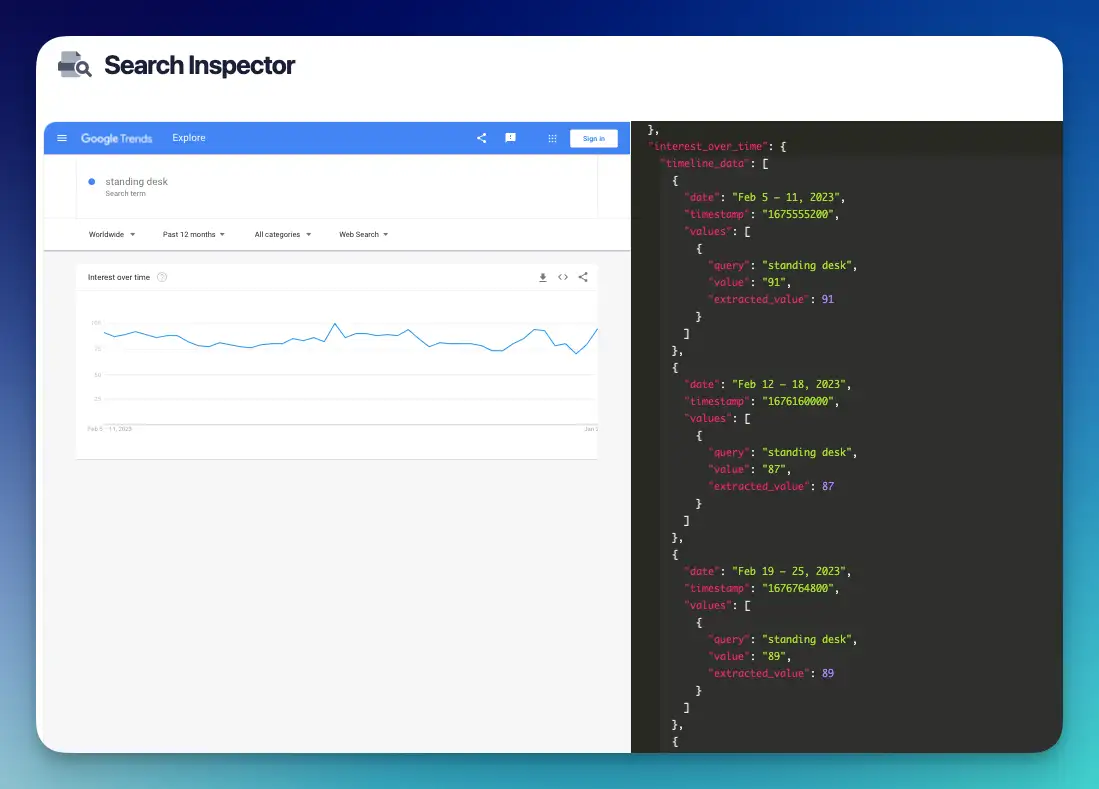
Please note, that we only return the response in JSON format. You'll need to build the graph yourself if you need one.
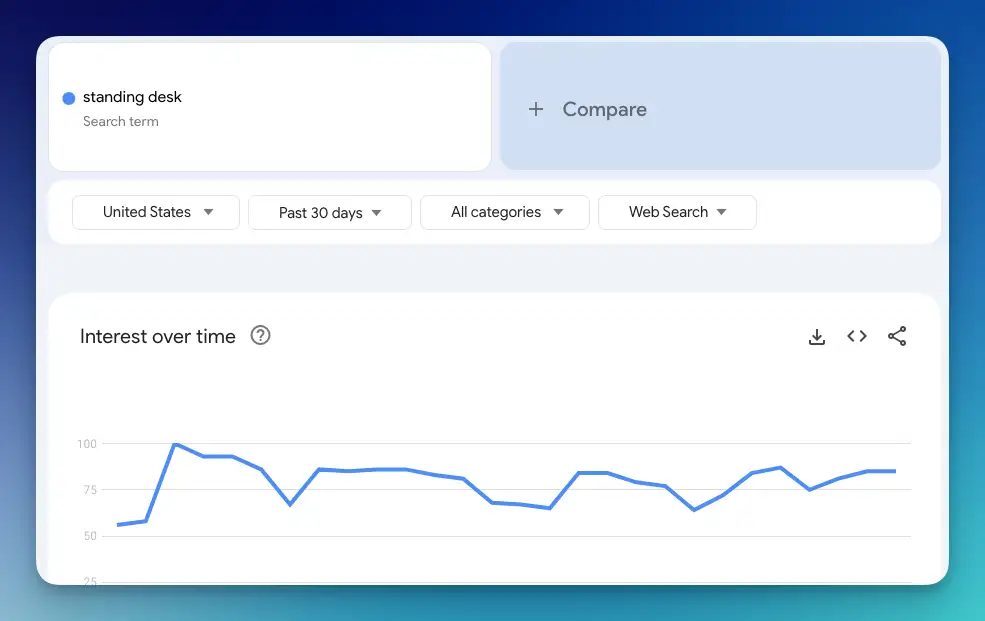
Step 4: Adjust region and timeline
Let's change the settings. I set the region to United States and timeline to Past 30 days .
Let's see how it is represented in our code:
search = client.search(
engine="google_trends",
q="standing desk",
api_key=api_key,
geo="US", // Two-code-letter country code
date="today 1-m" // Timeline for last 1 month
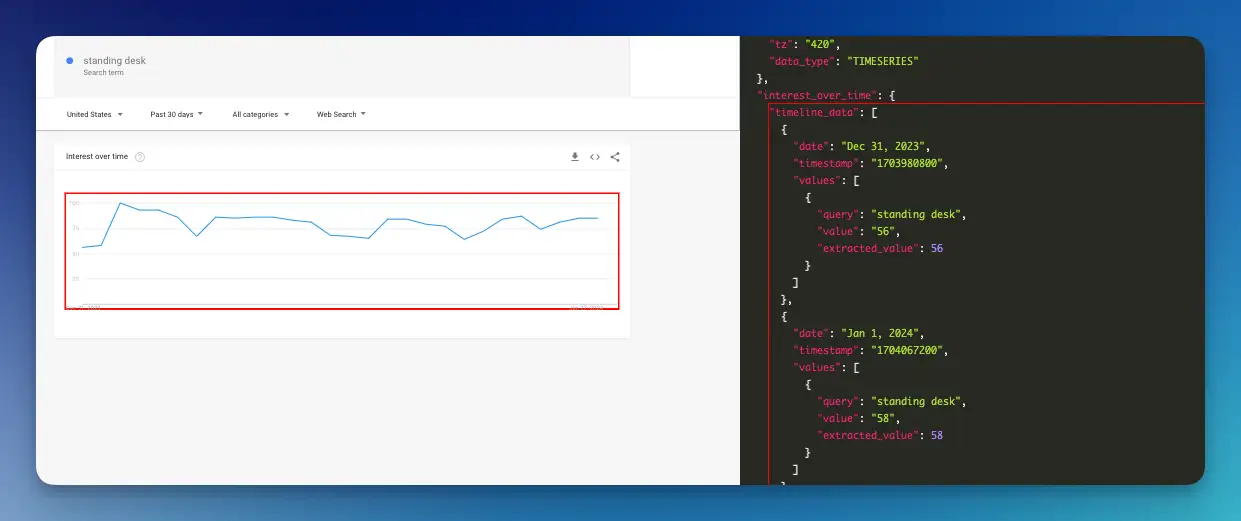
)The result is perfect as well:
More information about available parameters:
SerpApi Google Trends API features
Using SerpApi, it's possible to grab other parts from Google Trends, like the breakdown by region result, interest by region, related queries, related topics, and what's trending now.
Searching for multiple terms
It's possible to search for multiple terms. You can separate the terms by a comma. Here are the limitations:
- Max 5 terms per search
- Max 100 characters per search
search =  client.search(
    engine="google_trends",
    q="standing desk, ergonomic chair",
    api_key=api_key,
)
Interest by Region
We can grab the data for interest by region. We need to change the data_type to GEO_MAP_0
search = client.search(
    engine="google_trends",
    q="coffee latte",
    date="today 12-m",
    tz="420",
    data_type="GEO_MAP_0", // Important part
    api_key=api_key,
)
Here is the list of possible values for data_type
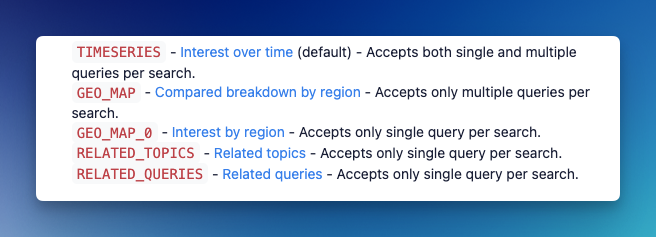
For example, if you're interested in the related topics, you need to adjust your code to:
search = client.search(
    engine="google_trends",
    q="coffee latte",
    date="today 12-m",
    tz="420",
    data_type="RELATED_TOPICS", // Adjust this accordingly
    api_key=api_key,
)

print(search)
References to our other related APIs:
- Trends Autocomplete API
- Trends Breakdown by region API
- Trends by Region API
- Interest overtime API
- Trends related queries API
- Trends related topics API
- Trending Now API
Pytrends Tutorial to scrape Google Trends data
There is also another unofficial API for Google Trends for Python. It's called Pytrends. We'll see a basic tutorial on how to implement this.
Please note that the repository has not been very active these last few months. There are also some unaddressed issues. Therefore, we recommend using the Google Trends API instead.
Install Pytrends.
pip install pytrendsInitialize the object. We also initialize pandas so it's easier to read the data.
from pytrends.request import TrendReq
import pandas as pd

pytrend = TrendReq()
pytrend.build_payload(kw_list=['Standing Desk'])
Inside the build_payload method, we can put the keywords list in an array.
Interest Over Time
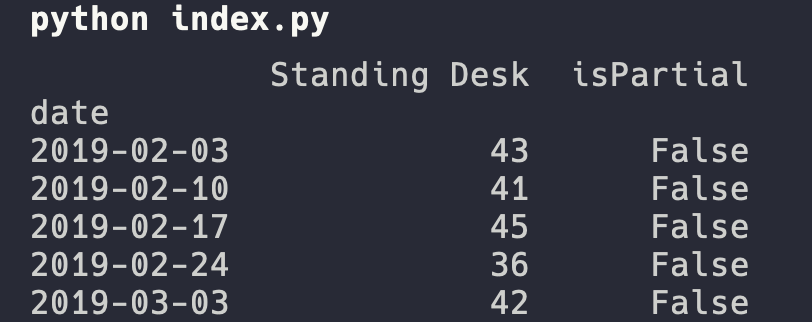
# Interest over time
pytrend = TrendReq()
pytrend.build_payload(kw_list=['Standing Desk'])
df = pytrend.interest_over_time()
print(df)
Here is the result:
There are some other parameters for build_payload method. Unfortunately, I sometimes get error results. Here are the parameters you can play with: year_start, month_start, day_start, hour_start, year_end, month_end, day_end, hour_end.
Interest by Region
Here is how to split the trends by country and sort the top 10 results:
pytrend = TrendReq()
pytrend.build_payload(kw_list=['Standing Desk'])
df = pytrend.interest_by_region(resolution='COUNTRY')
print(df.sort_values(by='Standing Desk', ascending=False).head(10))
Related topics
Here is how to show related topics using Pytrends:
df = pytrend.related_topics()
print(df)
Related queries
Here is how to show related topics using Pytrends:
df = pytrend.related_queries()
print(df)
Trending searches
Here is how to display trending searches by Region from Google Trends:
#Trending Searches
df = pytrend.trending_searches(pn='united_states') # trending searches in real time for United States
print(df.head)
The following API methods are available for PyTrends:
- Interest Over Time: returns historical, indexed data for when the keyword was searched most as shown on Google Trends' Interest Over Time section.
- Multirange Interest Over Time: returns historical, indexed data similar to interest over time but across multiple time and date ranges.
- Historical Hourly Interest: returns historical, indexed, hourly data for when the keyword was searched most, as shown on Google Trends' Interest Over Time section. It sends multiple requests to Google, each retrieving one week of hourly data. It seems like this would be the only way to get historical, hourly data.
- Interest by Region: returns data for where the keyword is most searched, as shown in Google Trends' Interest by Region section.
- Related Topics: returns data for the related keywords to a provided keyword shown on Google Trends' Related Topics section.
- Related Queries: returns data for the related keywords to a provided keyword shown on Google Trends' Related Queries section.
- Trending Searches: returns data for the latest trending searches shown on Google Trends' Trending Searches section.
- Top Charts: returns the data for a given topic shown in Google Trends' Top Charts section.
- Suggestions: returns a list of additional suggested keywords that can be used to refine a trend search.
Thank you for reading this blog post! I hope it can help you to gather data from the Google Trends site.
We have a Google Trends playground where you can play with our API: https://serpapi.com/playground?engine=google_trends
See you in the next post!
