 Ruby
Ruby
 Golang
 .Net
.Net
 MCP
MCP
 C++
C++

If you maintain an open-source project or track bugs in a public repository, you know how fast GitHub issues can pile up. This tutorial shows you how to pull issue data from the GitHub REST API, transform it into structured metrics, and visualize trends.
By the end, you'll have a Streamlit dashboard that shows open vs closed counts, issue aging, service breakdown, and trends over time. The entire app is a single Python file; I built it against the SerpApi Public Roadmap repository, which has over 3,600 issues, but it works with any public GitHub repo.

Set up your environment
We'll use Streamlit, a Python framework that turns scripts into interactive web apps with minimal code. You need:
- Python 3.8+
- A GitHub personal access token
- Dependencies (
pandas,streamlit,requests)
GitHub recommends the fine-grained tokens over the classic token. Create one with "public repositories" selected under repository access.
Export your GitHub token and run the app:
export GITHUB_TOKEN="your_token_here"
streamlit run app.py
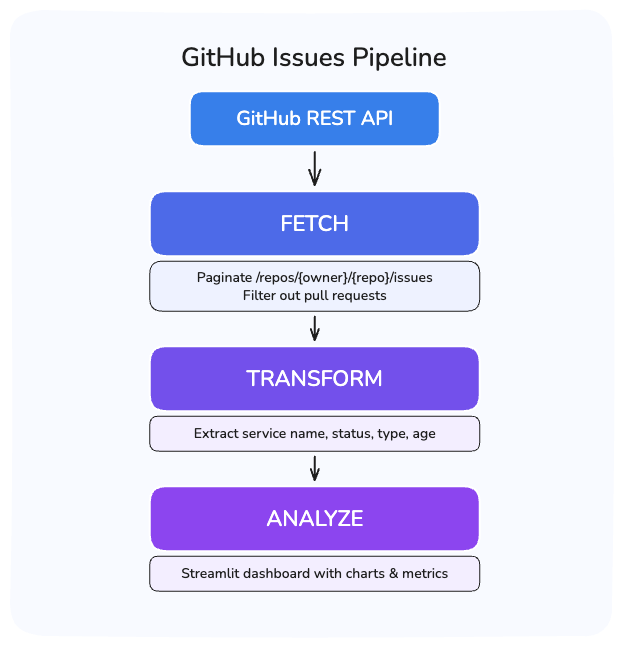
The Pipeline
The app follows three steps:
- Fetch the raw issues from GitHub.
- Transform them into structured data.
- Display the analysis.
How to fetch the Issues
The GitHub REST API exposes issues through GET /repos/{owner}/{repo}/issues. Each request returns up to 100 issues, so repositories with more require pagination.
Here's the fetch function. Two things to note in the script:
- The
pull_requestcheck filters out PRs (GitHub's Issues endpoint returns both). - The
422check handles a pagination limit we'll explain below.
def fetch_issues_by_state(owner, repo, state, headers):
    """Fetch all issues for a given state (open/closed), handling pagination."""
    issues = []
    page = 1

    while True:
        response = requests.get(
            f"{BASE_URL}/repos/{owner}/{repo}/issues",
            headers=headers,
            params={"state": state, "per_page": 100, "page": page},
        )

        # GitHub returns 422 when pagination exceeds ~1,000 results
        if response.status_code == 422:
            break

        # Rate limit exceeded
        if response.status_code in (403, 429):
            raise Exception(
                "GitHub API rate limit exceeded. "
                "Wait a few minutes and try again, or check your GITHUB_TOKEN."
            )

        response.raise_for_status()
        data = response.json()

        if not data:
            break

        for issue in data:
            # The Issues endpoint returns PRs too; filter them out
            if "pull_request" not in issue:
                issues.append(issue)

        page += 1

    return issues
Pagination limit
When I first tested this script, I used state=all to fetch everything in one loop. It worked until page 11, when GitHub returned a 422 Unprocessable Entity. GitHub cap pagination at roughly 1,000 results per query. Page 11 at 100 per page exceeds that limit.
Each query stays under the 1,000-result cap. This gives us roughly 1,900 issues total, enough for a meaningful analysis.
The @st.cache_data(ttl=300) decorator is specific to Streamlit. It caches the return value for 5 minutes. Without it, Streamlit re-executes the entire script on every user interaction. A single click would trigger 20+ API requests.
The SerpApi public roadmap repository has over 3,600 issues. A single query can't reach them all. The fix is to split into two separate queries:
@st.cache_data(ttl=300)
def fetch_all_issues(owner, repo):
    """Fetch all issues from the repo, excluding pull requests."""
    headers = {}
    if GITHUB_TOKEN:
        headers["Authorization"] = f"Bearer {GITHUB_TOKEN}"

    open_issues = fetch_issues_by_state(owner, repo, "open", headers)
    closed_issues = fetch_issues_by_state(owner, repo, "closed", headers)

    return open_issues + closed_issues
Rate limits: without a token, you get 60 requests per hour. With a personal access token, 5,000. For this app, always authenticate. For more details, refer to the rate limit docs.
Transform the Issues
The raw API response has dozens of fields per issue. Most are irrelevant for analysis. The transformation extracts what matters and processes the derived metrics.
Here's what a single issue looks like when we fetch it from the API:
{
    "number": 3654,
    "title": "[Google search API] - shows only images, FAQ, AI snippet or video on a valid
  search (Location error)",
    "state": "closed",
    "created_at": "2026-03-26T14:03:30Z",
    "closed_at": "2026-03-26T14:50:58Z",
    "labels": [
      {
        "name": "type: bug",
        "color": "FEF2C0",
        "description": "Something is broken"
      }
    ],
    "user": {
      "login": "annieiscorrie"
    },
    "comments": 4,
    "html_url": "https://github.com/serpapi/public-roadmap/issues/3654",
    "pull_request": null
  }
The basic fields (number, title, state, created_at) come straight from the API response. The interesting part is these specific fields:
age_days: days since creation. This is the metric that surfaces forgotten issues. Sorting by age immediately shows what's been sitting unresolved the longest.service: theserpapi/public-roadmaprepository encodes the affected component in the title using square brackets, like[Google Search API] Results missing paginationbecomes"Google Search API".
The regex\[(.+?)\]captures the text inside the first pair of brackets.
area/component/, milestones, or GitHub projects. Adjust the services extraction in transform_issue to match your repo's conventions.statusandtype: parsed from labels withstatus:andtype:prefixes. Check your target repository's labels before assuming a format.
def transform_issue(issue):
    """Convert a raw GitHub issue dict into a structured record."""
    created = datetime.fromisoformat(issue["created_at"].replace("Z", "+00:00"))
    age_days = (datetime.now(timezone.utc) - created).days
    labels = [label["name"] for label in issue.get("labels", [])]

    # Extract service from title prefix like "[Google Search]"
    match = re.search(r"\[(.+?)\]", issue["title"])
    service = match.group(1) if match else "General"

    # Extract status and type from label prefixes
    status = next(
        (l.split(": ", 1)[1] for l in labels if l.startswith("status:")), "none"
    )
    type_ = next(
        (l.split(": ", 1)[1] for l in labels if l.startswith("type:")), "none"
    )

    return {
        "number": issue["number"],
        "title": issue["title"],
        "state": issue["state"],
        "created_at": created.strftime("%Y-%m-%d"),
        "age_days": age_days,
        "labels": labels,
        "service": service,
        "status": status,
        "type": type_,
    }
Analyze the Issues
With the data transformed into a pandas DataFrame, Streamlit handles the display. The dashboard starts with a repository selector so you can analyze any public repo without changing the code:
with st.form("repo_form"):
    col_owner, col_repo, col_btn = st.columns([2, 2, 1])
    with col_owner:
        owner = st.text_input("Owner", value="serpapi")
    with col_repo:
        repo = st.text_input("Repository", value="public-roadmap")
    with col_btn:
        submitted = st.form_submit_button("Fetch Issues")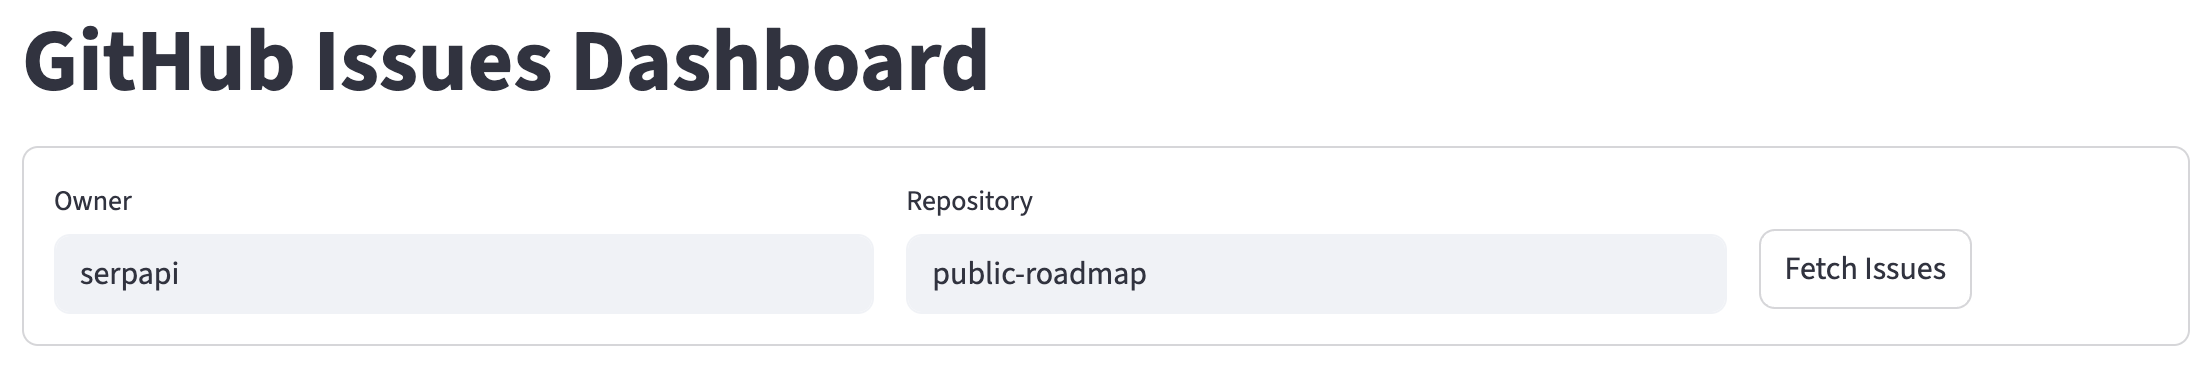
After submitting, the dashboard displays four sections.
Display a Metrics Summary
Three numbers at the top for a quick overview:
col1, col2, col3 = st.columns(3)
col1.metric("Total Issues", total)
col2.metric("Open", open_count)
col3.metric("Closed", closed_count)
Chart Status and Type Distribution
A bar chart for statuses and a donut for types side by side. We use Altair instead of Streamlit's built-in st.bar_chart because it gives control over chart type, orientation, tooltips, and styling. Altair ships with Streamlit, so there's nothing extra to install.
col_left, col_right = st.columns(2)

with col_left:
    st.subheader("Issues by Status")
    status_df = df["status"].value_counts().reset_index()
    status_df.columns = ["status", "count"]

    status_chart = (
        alt.Chart(status_df)
        .mark_bar(cornerRadiusTopLeft=4, cornerRadiusTopRight=4)
        .encode(
            x=alt.X("status:N", sort="-y", title=""),
            y=alt.Y("count:Q", title="Issues"),
            color=alt.value("#4A90D9"),
        )
        .properties(height=350)
    )
    st.altair_chart(status_chart, use_container_width=True)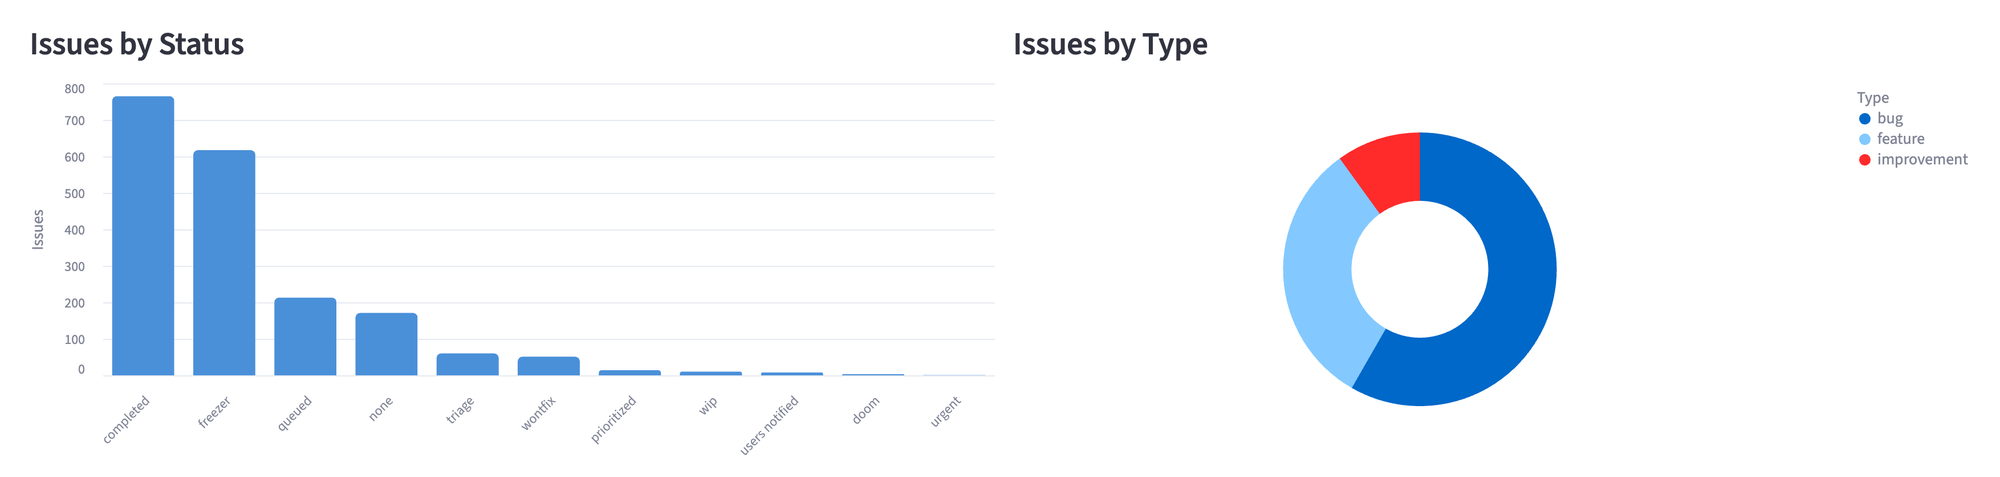
Track Issues Over Time
An area chart showing issues opened per month, split by state:
df["month"] = pd.to_datetime(df["created_at"]).dt.to_period("M").astype(str)
monthly_state = df.groupby(["month", "state"]).size().reset_index(name="count")

timeline = (
    alt.Chart(monthly_state)
    .mark_area(opacity=0.6)
    .encode(
        x=alt.X("month:N", title=""),
        y=alt.Y("count:Q", title="Issues"),
        color=alt.Color("state:N"),
        tooltip=["month:N", "state:N", "count:Q"],
    )
    .properties(height=350)
)
st.altair_chart(timeline, use_container_width=True)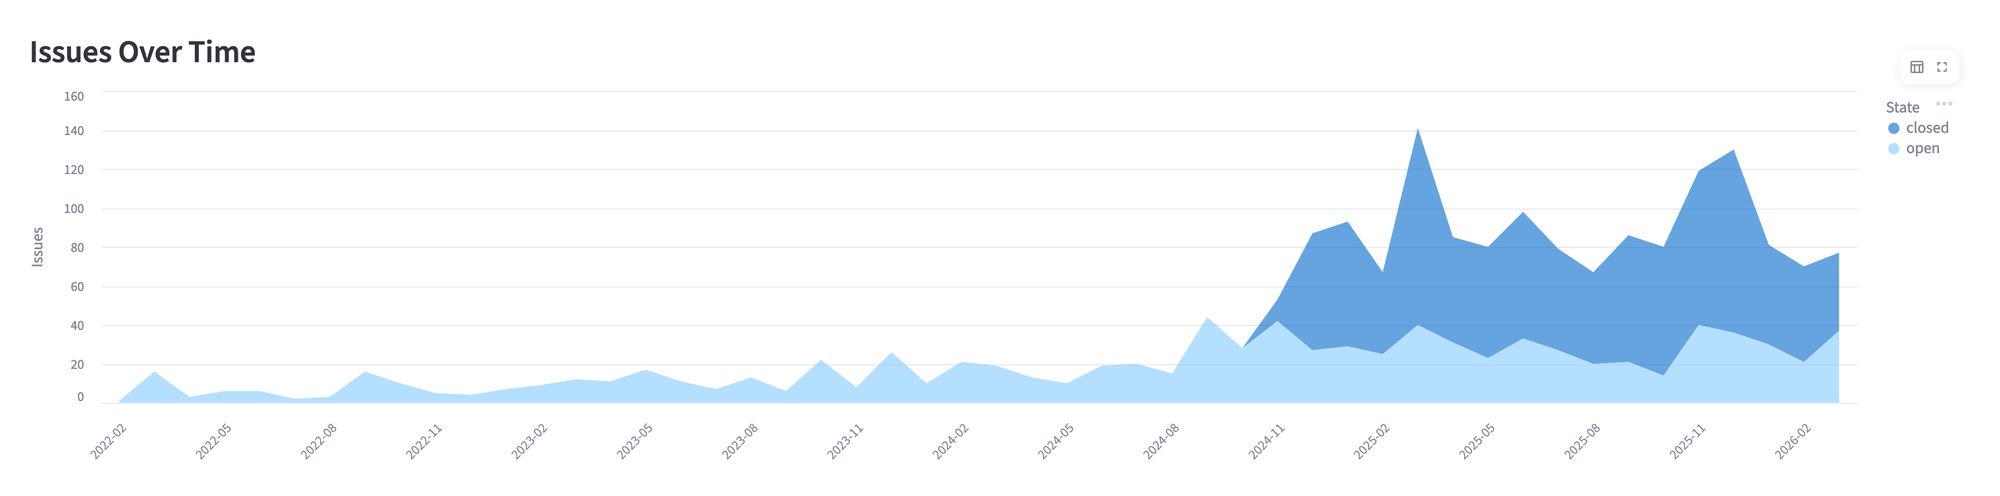
Compare Services and Measure Aging
The last row pairs two charts, one with services that have the most issues and the other with how old the open ones are. And for aging, we bucket open issues into time ranges:
def age_bucket(days):
    if days < 7:
        return "< 7 days"
    elif days < 30:
        return "7-30 days"
    elif days < 90:
        return "30-90 days"
    elif days < 180:
        return "90-180 days"
    elif days < 365:
        return "180-365 days"
    else:
        return "> 365 days"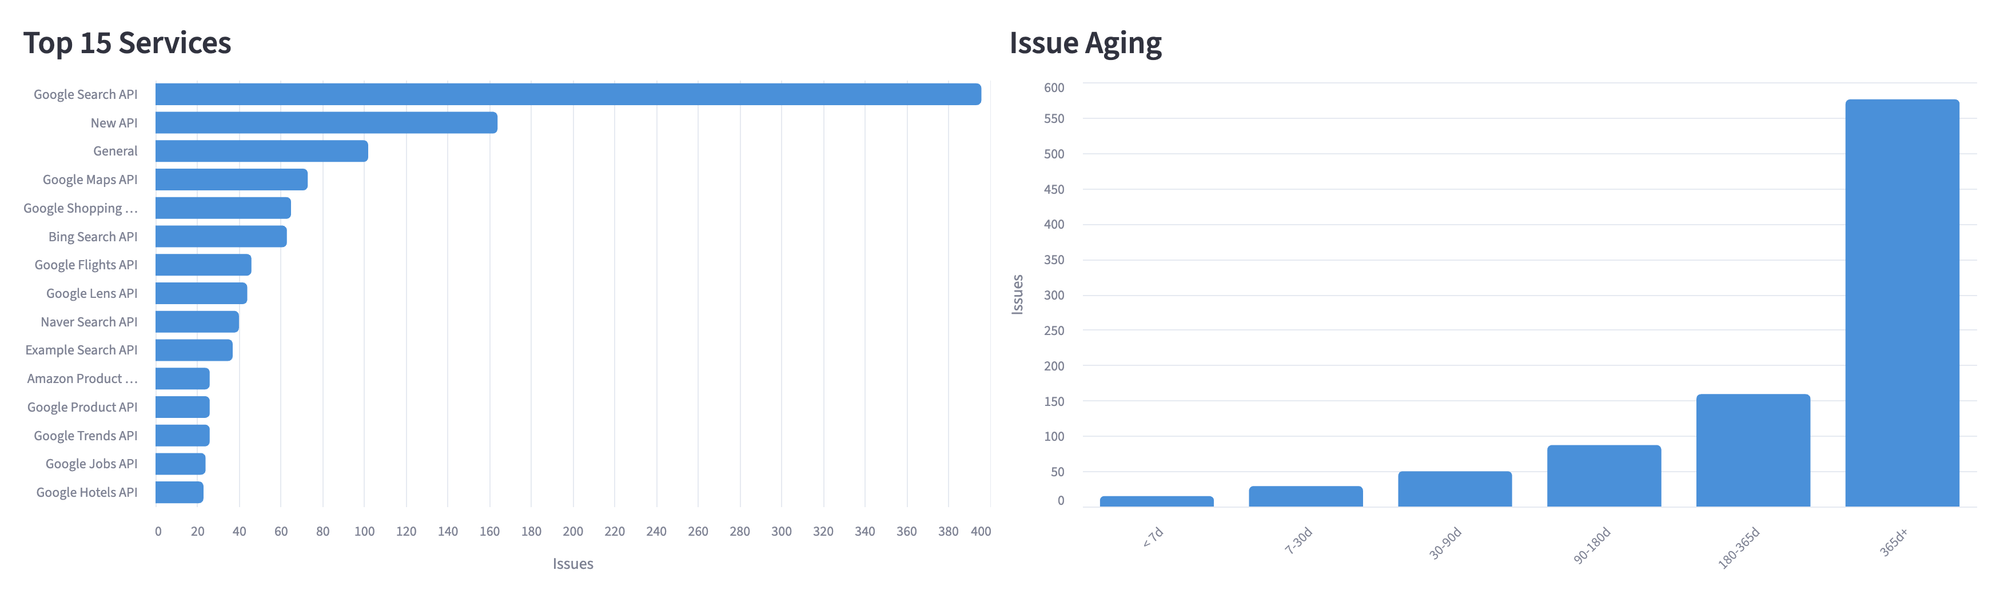
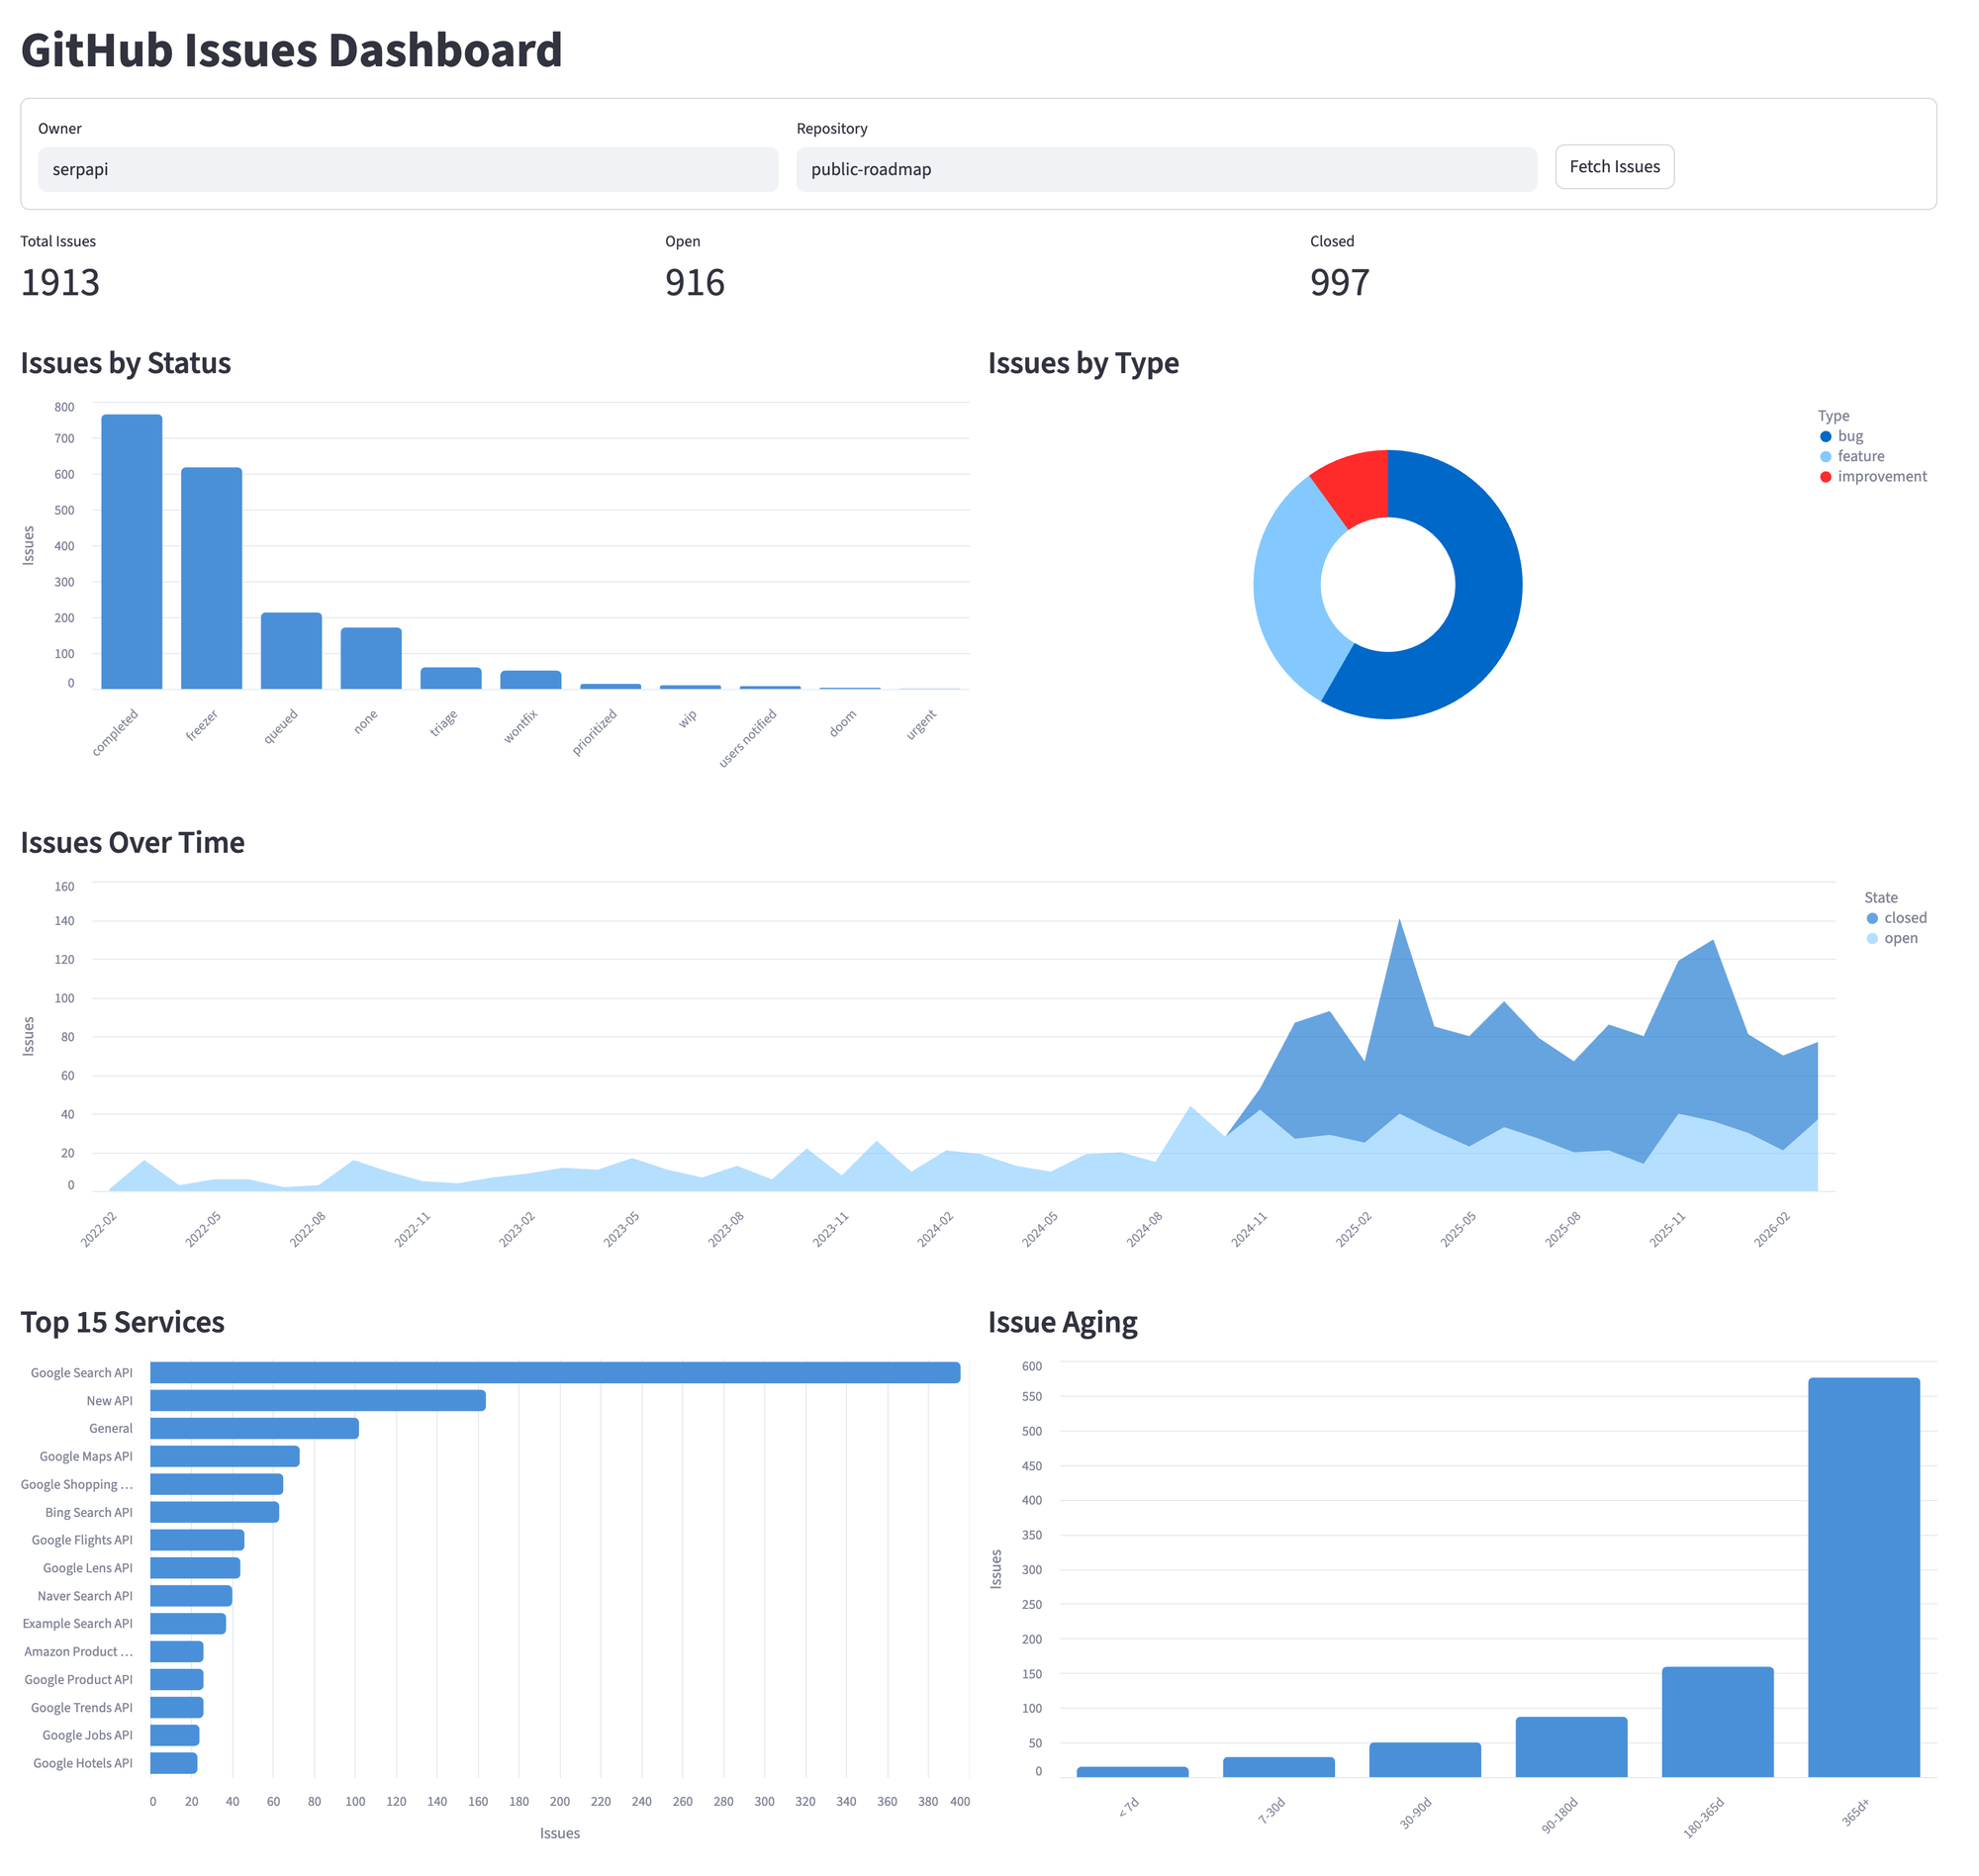
Dashboard Complete View
Here's the full dashboard running against serpapi/public-roadmap. The repository selector at the top lets you switch to any public repo. All five sections update together when you fetch a new repository.
When to use this approach
Ideal for:
- Track the health of open-source projects you depend on or maintain.
- Building internal dashboards for product roadmap visibility.
Not recommended for:
- Repositories with fewer than 50 issues, because the manual review will be faster.
- Real-time monitoring and the API rate limits make the polling impractical.
- Fetching complete history from repositories with 10,000+ issues.
Conclusion
The full application is 220 lines in a single Python file. The dashboard includes a repository selector, so you can point it at any public GitHub repository without touching any code, and everything runs locally, so you have control over everything.
What started as a quick experiment to understand a public roadmap became a tool I use daily. The GitHub API gives everything you need; the work is in structuring the data to answer the question that the web interface doesn't provide.