Ruby
Ruby
 Golang
 .Net
.Net
 MCP
MCP
 C++
C++

According to Wasabi Performance Benchmark Report 2019 & 2021, it claims Wasabi cloud storage performs better than Amazon S3, in terms of Write (PUT) Throughput and Read (GET) Throughput. In fact it is way better than Amazon S3 as claims in the report.
We are customers of both cloud storage, so we are curious to know if what they claimed is true. One of the great things about Wasabi is they are in fact a lot cheaper than the competitors including Amazon S3 and we are pretty happy about it. If what they claimed is true, we might considering migrate our entire cloud storage from Amazon S3 to Wasabi, seems like a no brainer decision.
Alright, it is time for us to find out more. We will run with the same parameters as in the report but we are not going to have the similar infrastructure setup. SerpAPI is hosted in Digital Ocean VM and to make this benchmark useful to our team, we will setup a new Ubuntu server in Digital Ocean to run the benchmark.
Server specifications
- Ubuntu 20.04
- 128GB / 32 Dedicated CPUs
- Server located in New York 1
For the cloud storage we will connect to us-east-1 to run all the benchmarks. The tool we will be using to run all the tests is an Open Source S3 Compatible Benchmark tool.
Testing Results & Analysis
We conducted 40 different tests that measured both read and write performance with a range of object sizes and the number of compute threads. The throughput results for each combination are provided in the tables below.
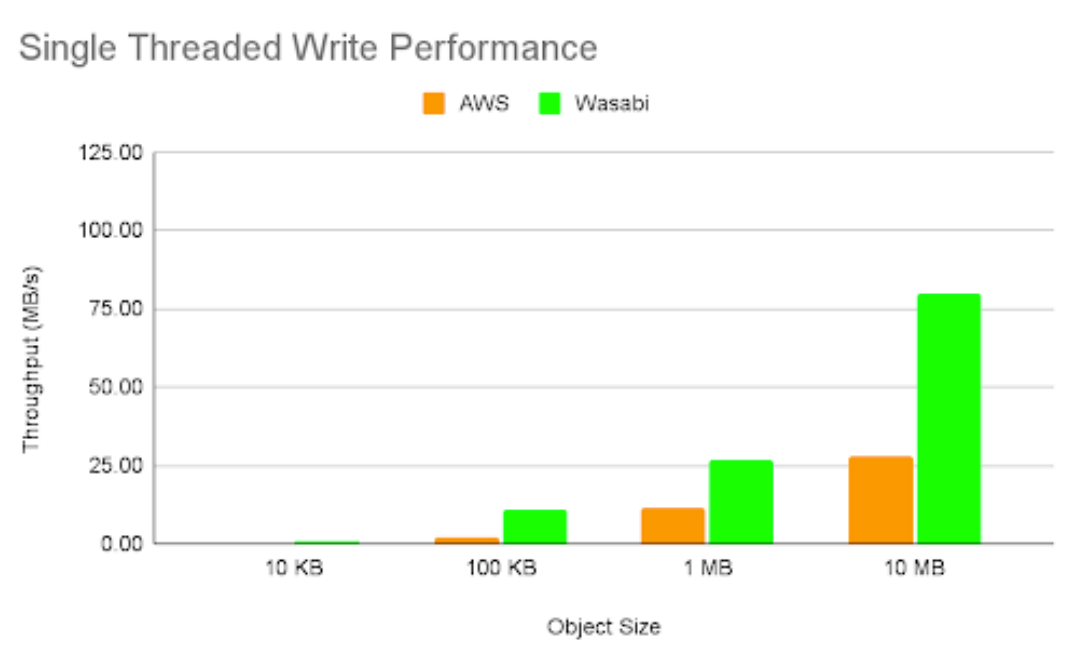
Write (PUT) Throughput - MB/s
| Object Size | 10KB | 100KB | 1MB | 10MB | ||||||||
|---|---|---|---|---|---|---|---|---|---|---|---|---|
| Threads | AWS | Wasabi | Ratio | AWS | Wasabi | Ratio | AWS | Wasabi | Ratio | AWS | Wasabi | Ratio |
| 1 | 0.16 | 0.11 | 0.69 | 1.7 | 1.2 | 0.71 | 8.4 | 5.4 | 0.64 | 32.1 | 15.6 | 0.49 |
| 5 | 0.82 | 0.58 | 0.71 | 7.2 | 5.5 | 0.76 | 43.5 | 29.3 | 0.67 | 182.5 | 75 | 0.41 |
| 10 | 1.6 | 1.3 | 0.81 | 14 | 10.6 | 0.76 | 86.5 | 62.6 | 0.72 | 215.9 | 163.2 | 0.76 |
| 20 | 3.1 | 2.6 | 0.84 | 30.5 | 22.3 | 0.73 | 162.3 | 129.9 | 0.8 | 233.6 | 236.6 | 1.01 |
| 30 | 4.7 | 4 | 0.85 | 46.8 | 37.1 | 0.79 | 229.5 | 188.7 | 0.82 | 231.6 | 232.7 | 1 |
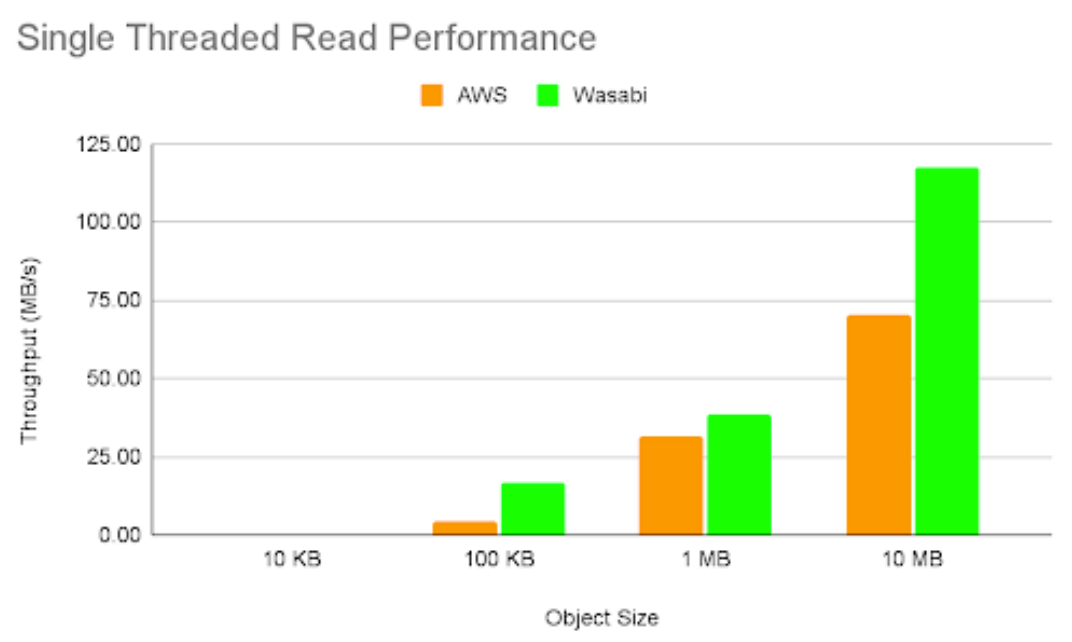
Read (GET) Throughput - MB/s
| Object Size | 10KB | 100KB | 1MB | 10MB | ||||||||
|---|---|---|---|---|---|---|---|---|---|---|---|---|
| Threads | AWS | Wasabi | Ratio | AWS | Wasabi | Ratio | AWS | Wasabi | Ratio | AWS | Wasabi | Ratio |
| 1 | 0.36 | 0.52 | 1.44 | 3.3 | 4.4 | 1.33 | 29.7 | 13.2 | 0.44 | 60.1 | 136.1 | 2.26 |
| 5 | 1.8 | 1.9 | 1.1 | 15.5 | 20.8 | 1.34 | 148.4 | 70.1 | 0.47 | 376.2 | 742.3 | 1.97 |
| 10 | 3.5 | 4.7 | 1.34 | 31.9 | 47.7 | 1.5 | 301.1 | 151.5 | 0.5 | 1100 | 1600 | 1.45 |
| 20 | 7.4 | 9.5 | 1.28 | 60.5 | 107.1 | 1.77 | 612 | 324.9 | 0.53 | 3700 | 4300 | 1.16 |
| 30 | 10.8 | 15.8 | 1.46 | 94.2 | 153.1 | 1.63 | 774.4 | 495.8 | 0.64 | 1700 | 8800 | 5.18 |
Summary
From our test results as shown in the tables above, AWS S3 outperformed Wasabi in Write (PUT) Throughput, it was about 1.2 - 1.8x varies between object sizes and number of threads. Interestingly, we get a totally opposite result for Read (GET) Throughput except for 1MB object size. Wasabi performed much better and it got even better when object size and number of threads increased.