Ruby
Ruby
 Golang
 .Net
.Net
 MCP
MCP
 C++
C++

In this article, we will talk about how to reverse engineer Google finance charts to parse them using Ruby on Rails.
Introduction
When you search on Google for something like Bitcoin price or bitcoin vs dollar we will notice a chart and very rich finance data, the original source of this data is Google finance.
What is Google finance?
Google Finance is a website focusing on business news and financial information hosted by Google.

Getting started
We will ignore all the other data and we will focus on parsing the chart only as the extract of the other elements have been covered by other SerpApi blog posts.
Basically, every chart or graph consists of two important parts (x-axis and y-axis).
The x-axis is a horizontal line and the y-axis is a vertical line.
Now we just need to understand the numbers in the Google finance chart, The y-axis represents the price column, and the x-axis represents the time.
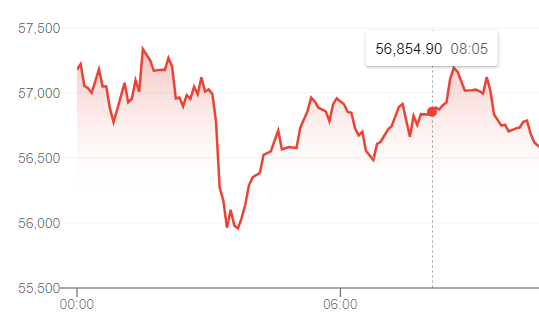
It's obvious now in the screenshot above, the price is 56,854.90 at 8:05.
Now we will find the chart CSS class:
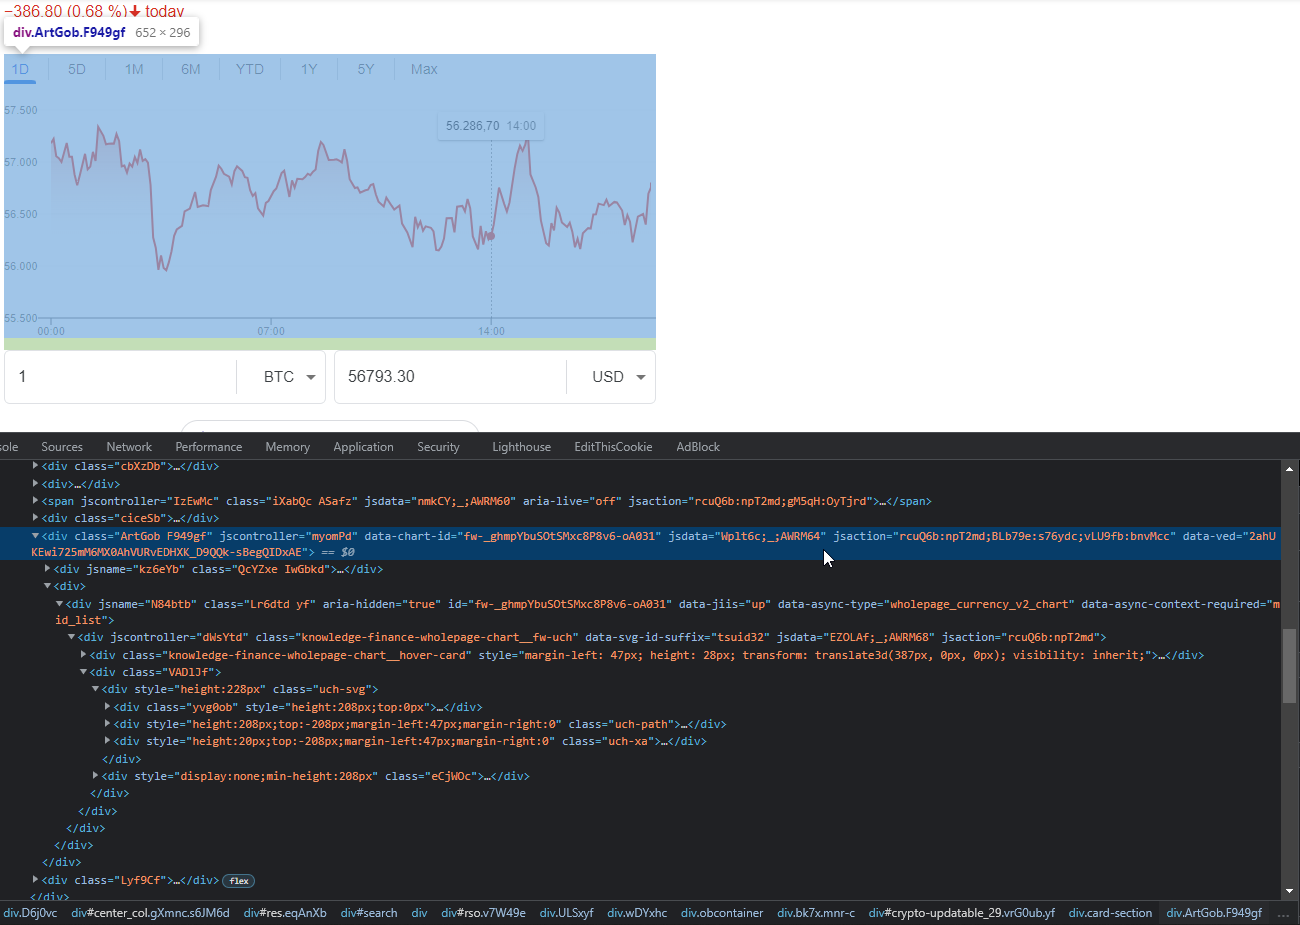
In this example, we will take the attribute,jsdata but we should note that the input of this attribute is changing every search.
So by using REGEX we will extract the last element inside jsdata="Wplt6c;_;AWRM64" which means the element we want is AWRM64
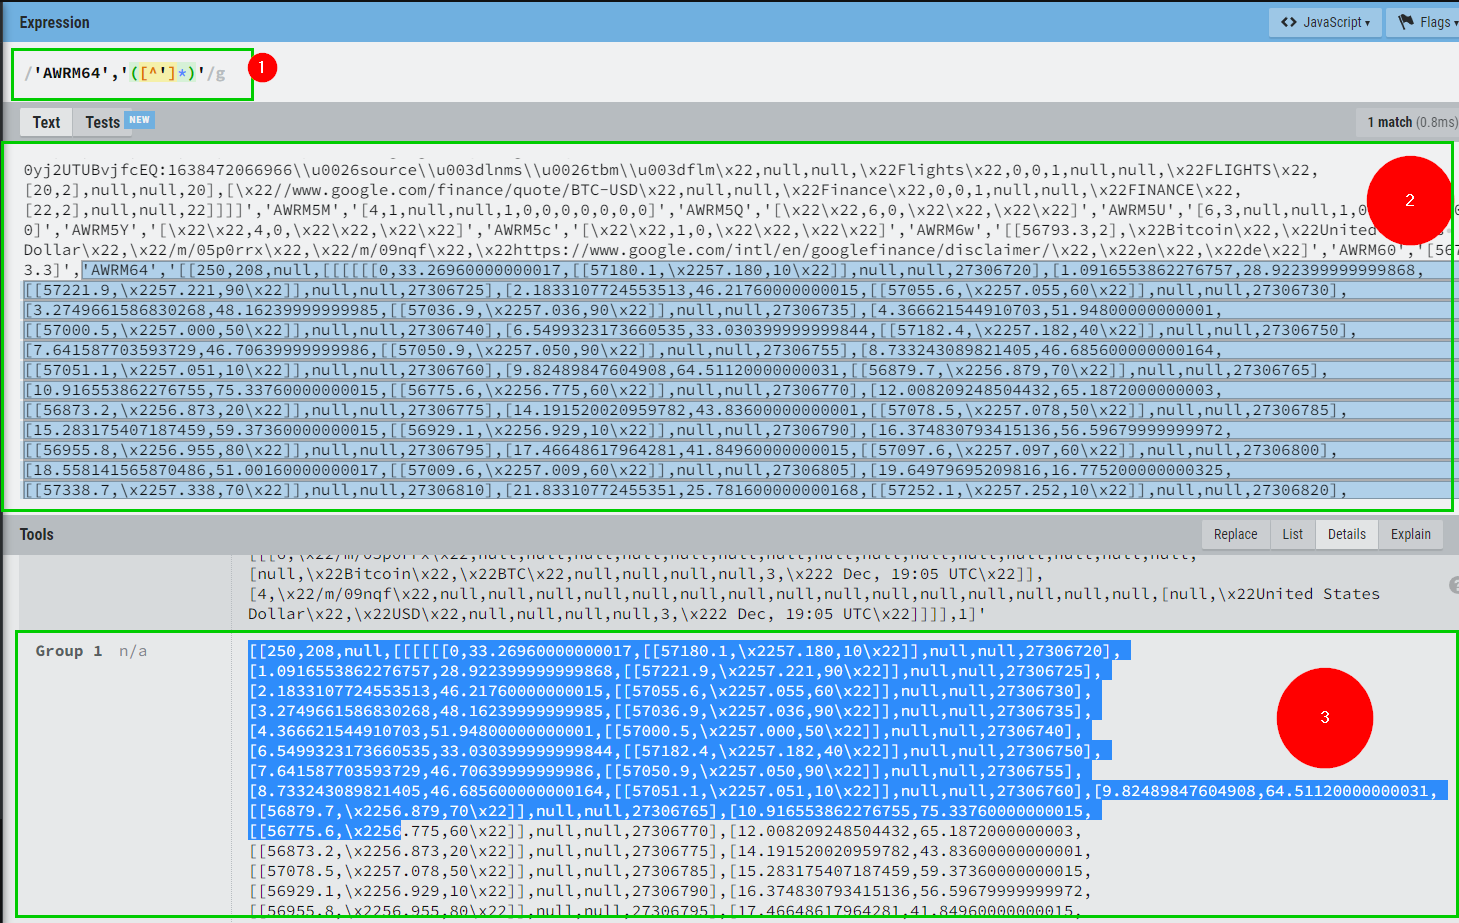
1- This is the Regex that we used to search in the page source for the chart data.
2- Is the raw HTML page - to search inside of it.
3- The result, which it's the group of the chart JSON data.
After formatting the JSON, now we need to understand what's inside the JSON carefully.
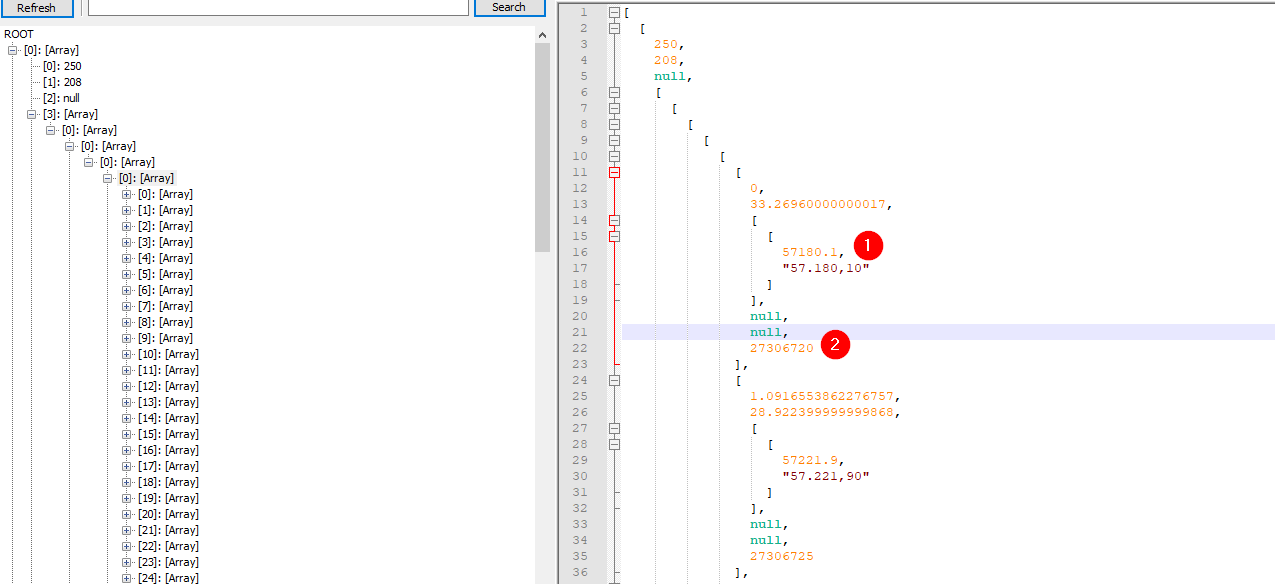
1- This number represents the price.
2- This one represents the time in minutes.
Putting everything together
Now we have to use dig method to extract the JSON data we need, which consists of the x-axis and y-axis arrays (price and time).
Then we will convert the time from minutes to hours, and we will use this formula to get the UNIX time:
unix_time = time * 60
and the last thing to do is convert the unix_time to DateTime ( UTC Y-M-D:H:M )
data[:time] = Time.at(time * 60).utc.strftime("%Y-%m-%d %H:%M %p")
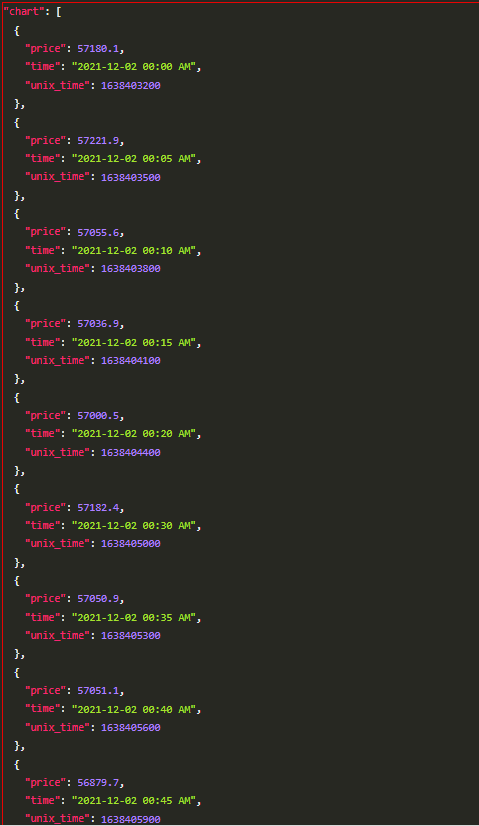
The final result:
Ending:
You can find the documentation about how to use serpapi and you can follow us on Twitter at @serp_api, to get our latest news and articles.