Ruby
Ruby
 Golang
 .Net
.Net
 MCP
MCP
 C++
C++

Recently, we observed the occasional failing deployments only on two of our servers. The failed servers were even closing my regular SSH connection. In this story, you'll learn how we reduced memory usage and made one piece of SerpApi code 1.5x faster.
TL;DR
str.count($/) was 1.5x faster compared to str.lines.count and didn't allocate additional memory. Also, String#count performance regressed from Ruby 3.0 to 3.1 when compiling with gcc (ref: https://bugs.ruby-lang.org/issues/19875).
Investigation
Only two servers faced the random failed deployments.
#<Thread:0x000055a170560e70 digital_ocean.rb:80 run> terminated with exception (report_on_exception is true):
SerpApi/vendor/bundle/ruby/2.7.0/gems/net-ssh-5.2.0/lib/net/ssh/transport/server_version.rb:54:in `readpartial': Connection reset by peer (Errno::ECONNRESET)
These servers also randomly closed my SSH connections.
$ ssh server-2
Last login: Fri Feb 24 14:23:29 2023 from {remote_ip}
client_loop: send disconnect: Broken pipe
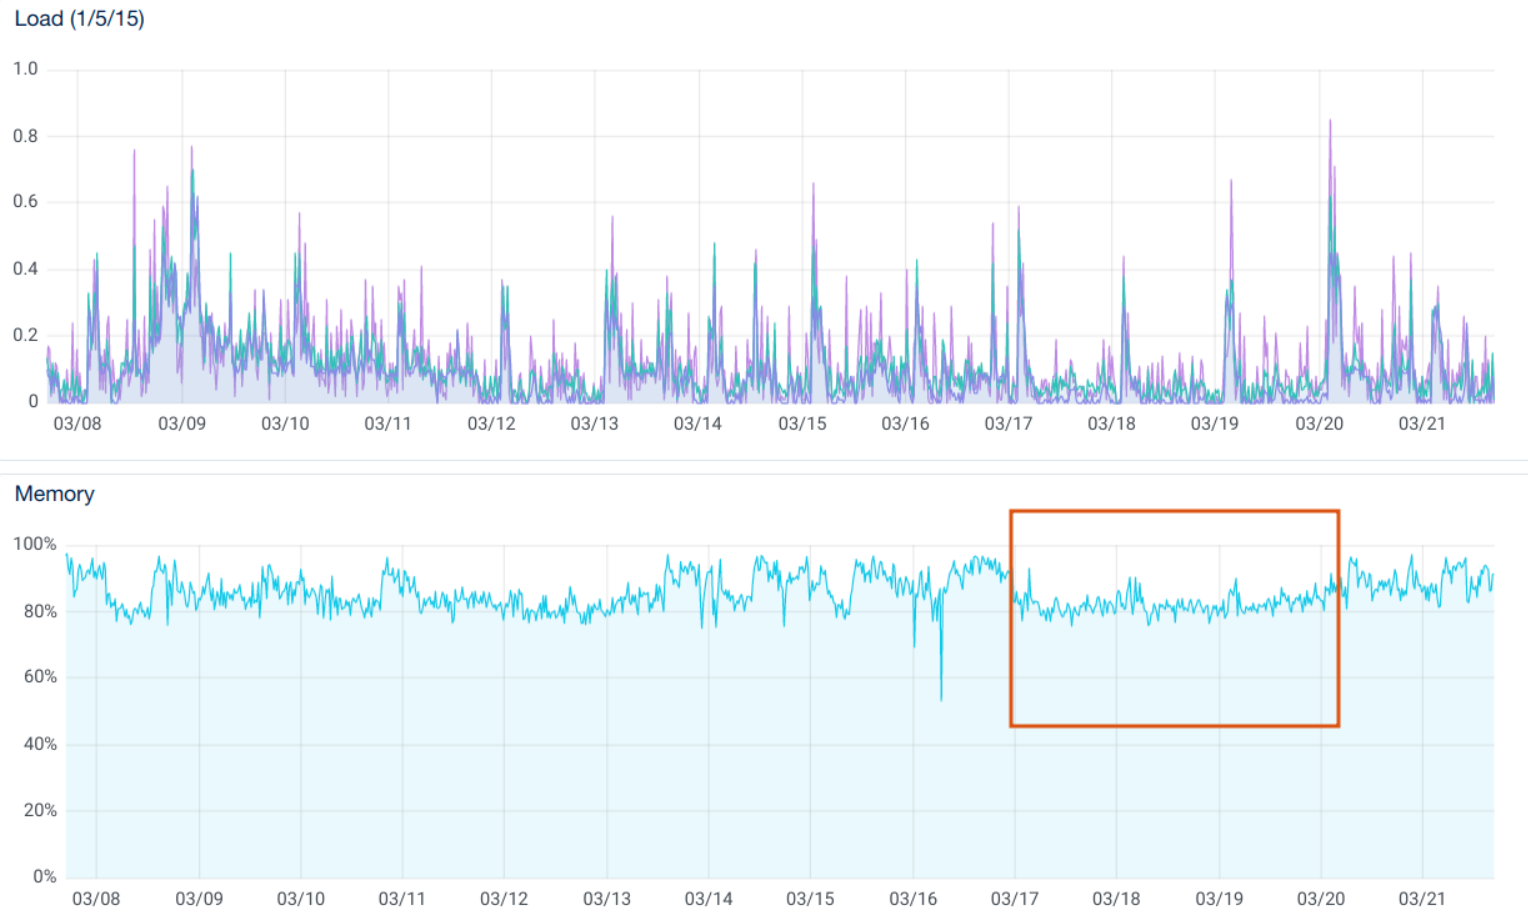
DigitalOcean server's graphs show that memory usage was near to 95% percent on these two servers. Load average was occasionally peaking at 12 compared to 2 on other servers.
We checked the Puma server flamegraph. Most of the wall time on production were the SearchSplitter#do_one_request and Puma thread pool.
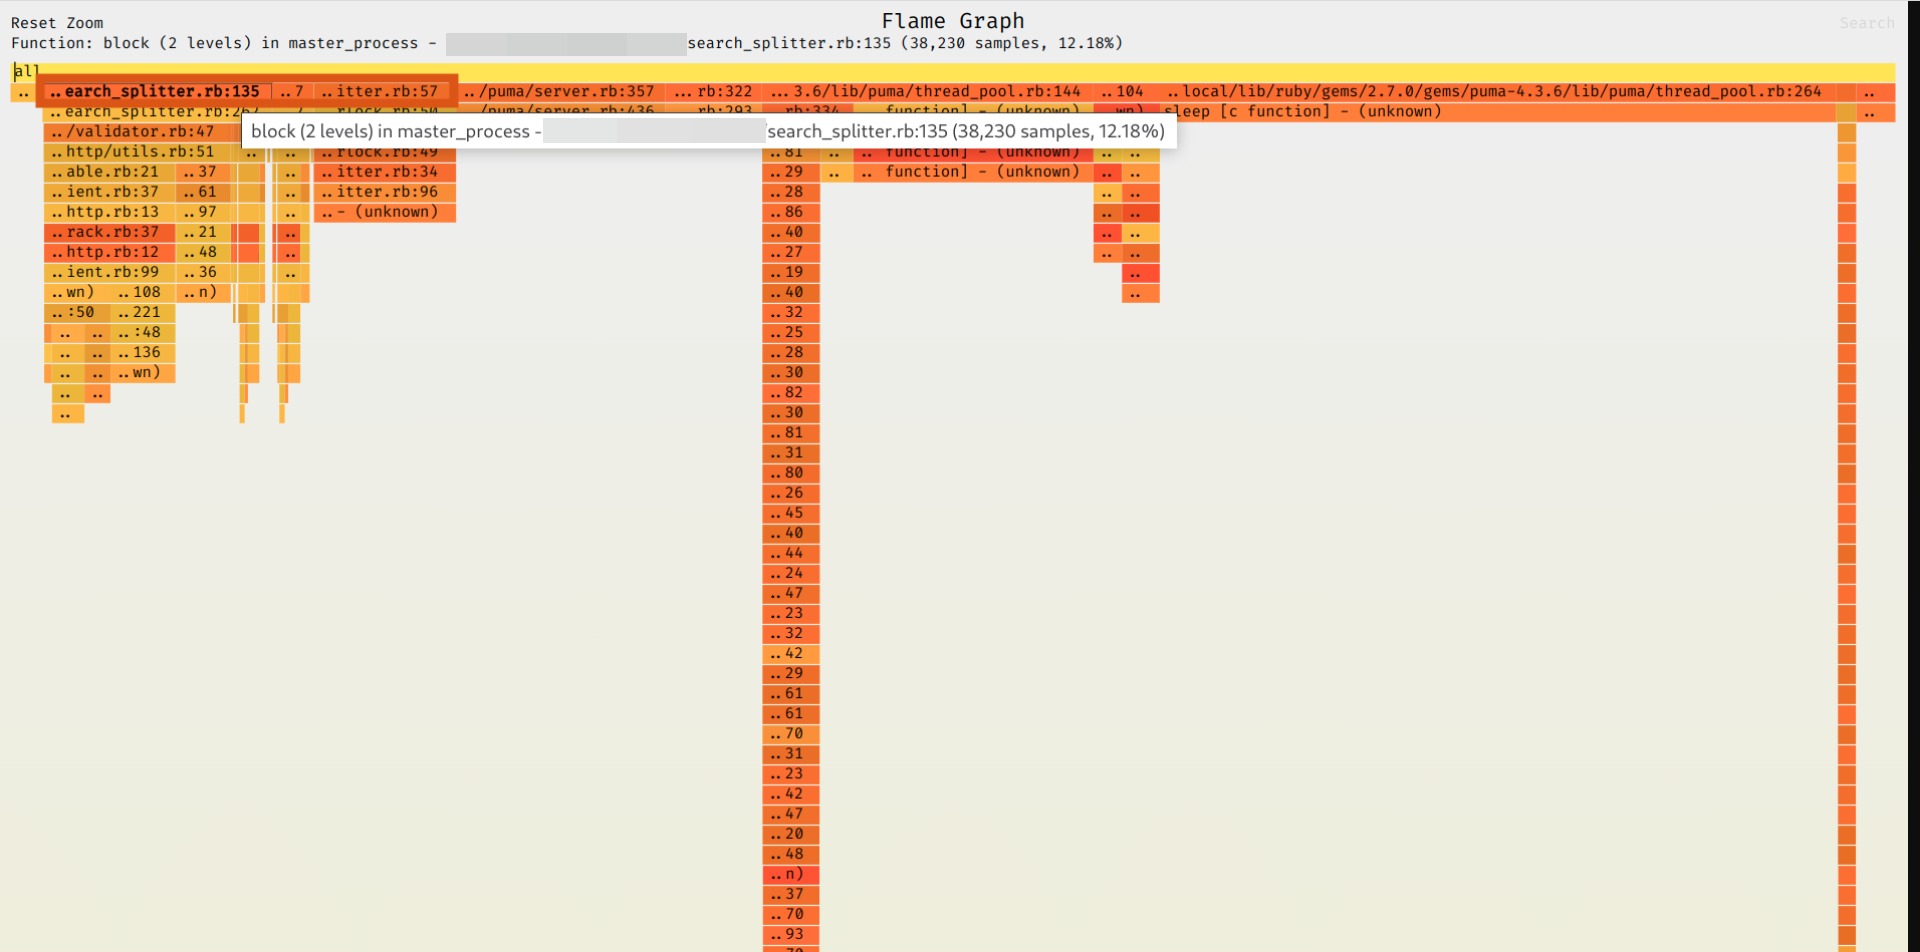
We used rbspy to generate the flamegraph:
$ rbspy record -p $PID_OF_PUMA_PROCESS
The flamegraph didn't reveal anything actionable and we moved to memory profiling.
Memory profiling
Here's the script we used:
require 'memory_profiler'

user = User.find_by(email: "me")

report = MemoryProfiler.report do
  threads = []

  (1..5).map do |i|
    (1..5).map do |j|
      threads << Thread.new {
        search = Search.new(engine: "google", q: "#{i} * #{j}", user: user)
        SearchProcessor.process(search)
      }
    end
  end

  threads.each(&:join)
end

report.pretty_print
It turned out that the top allocator was line counting in the response validator.
elsif response[:html].lines.count < 50 && response[:html].match?(/<div id=\"main\"><div id=\"cnt\"><div class=\"dodTBe\" id=\"sfcnt\"><\/div><H1>.+<\/H1>.+<p>.+<\/p>$/)
Why were the String#lines and Array#count the top allocators of the entire app?
String#lines
The HTML file size varies from 180 KB (regular organic results) to 1.3 MB (Google Shopping with num=100). The String#lines allocated an array multiple times per search because we send multiple requests concurrently per each search.
Thanks to @guilhermesimoes's gist, we found that str.each_line.count should be faster. But it was not optimal and we found a way to improve the solution.
Solution
The solution was super simple — str.count($/). Here's the diff:
- elsif response[:html].lines.count < 50 && response[:html].match?(/<div id=\"main\"><div id=\"cnt\"><div class=\"dodTBe\" id=\"sfcnt\"><\/div><H1>.+<\/H1>.+<p>.+<\/p>$/)
+ elsif response[:html].count($/) < 50 && response[:html].match?(/<div id=\"main\"><div id=\"cnt\"><div class=\"dodTBe\" id=\"sfcnt\"><\/div><H1>.+<\/H1>.+<p>.+<\/p>$/)
To make sure the problem was solved, we benchmarked multiple ways of counting string lines in Ruby. We reused and adopted the gist above to exclude File#read from the benchmark and added String#count to the benchmark.
We use Ruby 2.7.2 (EOL) in production because it's faster than 3.x for our use case (ref: https://serpapi.com/blog/benchmarking-ruby-3-1-yjit-ruby-2-7/).
Benchmark
String#count was 1.5 times faster than other options:
Warming up --------------------------------------
                size    31.000  i/100ms
              length    75.000  i/100ms
               count    77.000  i/100ms
   each_line + count    81.000  i/100ms
           count($/)   196.000  i/100ms
Calculating -------------------------------------
                size      1.529k (±33.9%) i/s -      4.774k in   5.015361s
              length      1.434k (±38.8%) i/s -      5.025k in   5.139834s
               count      1.335k (±40.7%) i/s -      4.697k in   5.079353s
   each_line + count      1.411k (±39.5%) i/s -      5.022k in   5.110146s
           count($/)      2.231k (± 2.6%) i/s -     11.172k in   5.012323s

Comparison:
           count($/):     2230.5 i/s
                size:     1529.0 i/s - 1.46x  (± 0.00) slower
              length:     1434.2 i/s - 1.56x  (± 0.00) slower
   each_line + count:     1411.0 i/s - 1.58x  (± 0.00) slower
               count:     1334.9 i/s - 1.67x  (± 0.00) slower
Here's the script:
require "benchmark/ips"

html = File.read(Rails.root.join("spec/data/google/superhero-movies-mobile-63f582a0defa1345501c6b50-2023-02-23.html"))

Benchmark.ips do |x|
  x.report("size") { html.lines.size < 50 }
  x.report("length") { html.lines.length < 50 }
  x.report("count") { html.lines.count < 50 }

  x.report("each_line + count") { html.each_line.count < 50 }

  x.report("count($/)") { html.count($/) < 50 }

  x.compare!
end
Memory usage
count($/) doesn't allocate a new array compared to lines/each_line/etc.
We used the awesome heap-profiler and heapy Ruby gems to profile memory usage.
lines/readlines/each_line/etc.
html.lines.count allocated the new array and referenced the original string for each iteration in the benchmark.
$ bundle exec heapy read ./tmp/lines_count/allocated.heap 49 --lines=1

Analyzing Heap (Generation: 49)
-------------------------------

allocated by memory (204879705) (in bytes)
==============================
  204872652  tmp/html_length_vs_count_vs_size_bench.rb:6

object count (5406)
==============================
  5301  tmp/html_length_vs_count_vs_size_bench.rb:6

High Ref Counts
==============================
  5300  tmp/html_length_vs_count_vs_size_bench.rb:6
We also used the predefined $/ line separator to allocate even less memory.
count($/)
Most of these memory allocations and all of the object reference counts were gone when we used the String#count($/).
$ bundle exec heapy read ./tmp/count_nl/allocated.heap 48 --lines=1

Analyzing Heap (Generation: 48)
-------------------------------

allocated by memory (2547465) (in bytes)
==============================
  2540804  tmp/html_length_vs_count_vs_size_bench.rb:4

object count (105)
==============================
  27  /usr/local/lib/ruby/gems/2.7.0/gems/activesupport/lib/active_support/deprecation/proxy_wrappers.rb:172

High Ref Counts
==============================
  73  /usr/local/lib/ruby/gems/2.7.0/gems/activesupport/lib/active_support/deprecation/proxy_wrappers.rb:172
Code
require "heap-profiler"

HeapProfiler.report(Rails.root.join('tmp/lines_count')) do
  html = File.read(Rails.root.join("spec/data/google/superhero-movies-mobile-63f582a0defa1345501c6b50-2023-02-23.html"))

  100.times { html.lines.count < 50 }
  # 100.times { html.count($/) < 50 }
end
Comparison process
The heap diff comparison was a bit manual because the heapy diff didn't provide a diff. We commented / uncommented 100.times { html.lines.count < 50 } and replaced paths in the command above.
## Profile heap
$ bundle exec rails r tmp/html_length_vs_count_vs_size_bench.rb

## Read summary of heap allocations
$ bundle exec heapy read ./tmp/count_nl/allocated.heap

## Read a specific generation (48) limiting number of lines to output (1)
$ bundle exec heapy read ./tmp/count_nl/allocated.heap 48 --lines=1
Results
Immediately after the fix was deployed, memory usage on the affected servers decreased and stabilized. Then memory usage fluctuated again, but deployments and SSH connections stabilized.
Observations and final thoughts
The initial assumption was the Puma graceful restart. During the phased-restart, Puma spawned additional workers to switch to the new code version (which was expected). It wasn't clear why SSH connections were dropping on two DigitalOcean droplets only.
Doubling the amount of RAM would also solve the problem, but it wouldn't be as efficient at this point. The fix was deployed half a year ago and the issue is definitely solved.
Update Sep 20th, 2023
Thanks to @Freaky from Reddit for a wonderful feedback and cooperation:
@Freakytracked down a performance regression inString#countin 3.1+@Freakybrought his old SIMD bytecount C port out of mothballs- MRI maintainer nobu is evaluating it for inclusion in MRI
@Freakynoted the bytecount Rust crate uses an SSE4.1 intrinsic in SSE2 code and submitted a fix- A similar fix for the aho-corasick Rust crate was made in response
I love it when you get this ripple effect from something that initially seems pretty innocuous.
Update Dec 5th, 2023
@Freakyjoined SerpApi
If you enjoy working on such challenges, come work here with us: https://serpapi.com/careers#open-roles