 Ruby
Ruby
 Golang
 .Net
.Net
 MCP
MCP
 C++
C++

When developing Nokolexbor, I found debugging with gdb or lldb was troublesome because I have to do everything with commands. For me, it will be more delightful to debug with an interactive GUI, which makes it convenient to control breakpoints and steps, inspect values and navigate through the code. This post shows how to use VS Code debugging tools to debug Ruby C extension from scratch.
Create the gem project
We demonstrate this on an empty gem project with extensions. The project can be easily created by:
bundle gem example_gem --extIf you already have a working gem project, just jump to the next section.
Let's modify ext/example_gem/example_gem.c to add a native method example_plus under ExampleClass that can be called by ruby code.
#include "example_gem.h"

VALUE rb_mExampleGem;
VALUE rb_cExampleClass;

static VALUE
example_plus(VALUE self, VALUE rb_a, VALUE rb_b)
{
  int a, b;
  a = NUM2INT(rb_a);
  b = NUM2INT(rb_b);
  return INT2NUM(a + b);
}

void Init_example_gem(void)
{
  rb_mExampleGem = rb_define_module("ExampleGem");
  rb_cExampleClass = rb_define_class_under(rb_mExampleGem, "ExampleClass", rb_cObject);
  rb_define_method(rb_cExampleClass, "example_plus", example_plus, 2);
}
Now, compile the extension: rake compile. If everything goes well, a shared library named example_gem.so or example_gem.bundle will be created under lib/example_gem
Let's test it in irb and make sure it works:
❯ irb -Ilib -rexample_gem
irb(main):001:0> obj = ExampleGem::ExampleClass.new
=> #<ExampleGem::ExampleClass:0x00007f902022ac88>
irb(main):002:0> obj.example_plus(2, 3)
=> 5
Debug in VS Code
By default, ruby compiles the C extension with -O3, which loses debug information. We should modify ext/example_gem/extconf.rb to add debug options.
require "mkmf"

if ENV['EXAMPLE_DEBUG']
  CONFIG["optflags"] = "-O0"
  CONFIG["debugflags"] = "-ggdb3"
end

create_makefile("example_gem/example_gem")
Here we are using an environment variable EXAMPLE_DEBUG to control whether we want to compile with debug information.
Just compile with EXAMPLE_DEBUG=1 rake compile.
Some posts would suggest that you compile ruby itself with the same debug flags as well, but as long as you don't need to debug ruby-related functions, just use the ruby you've installed.
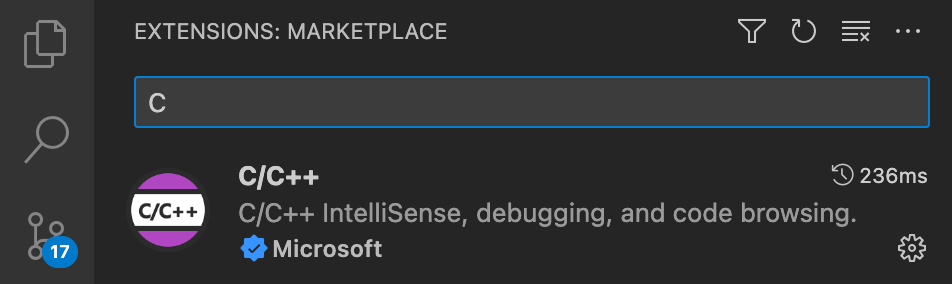
Now, let's open VS Code. First, install the official C/C++ extension
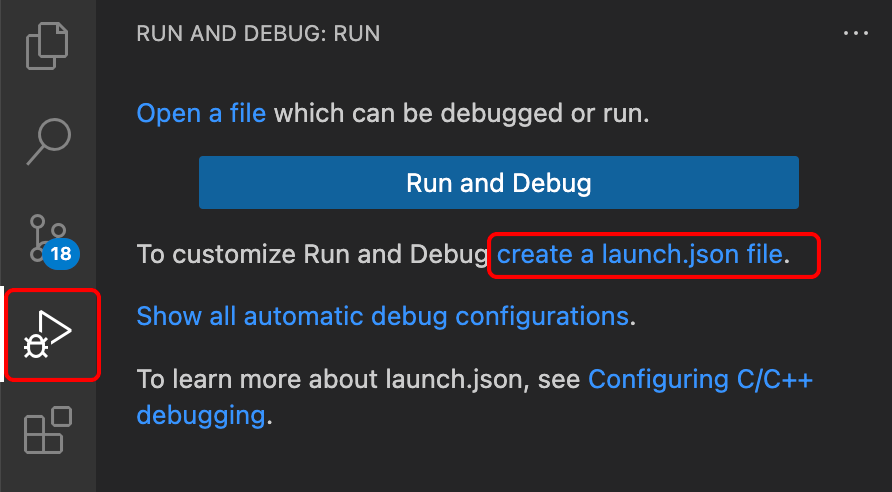
Switch to Run and Debug tab. Click create a launch.json file.
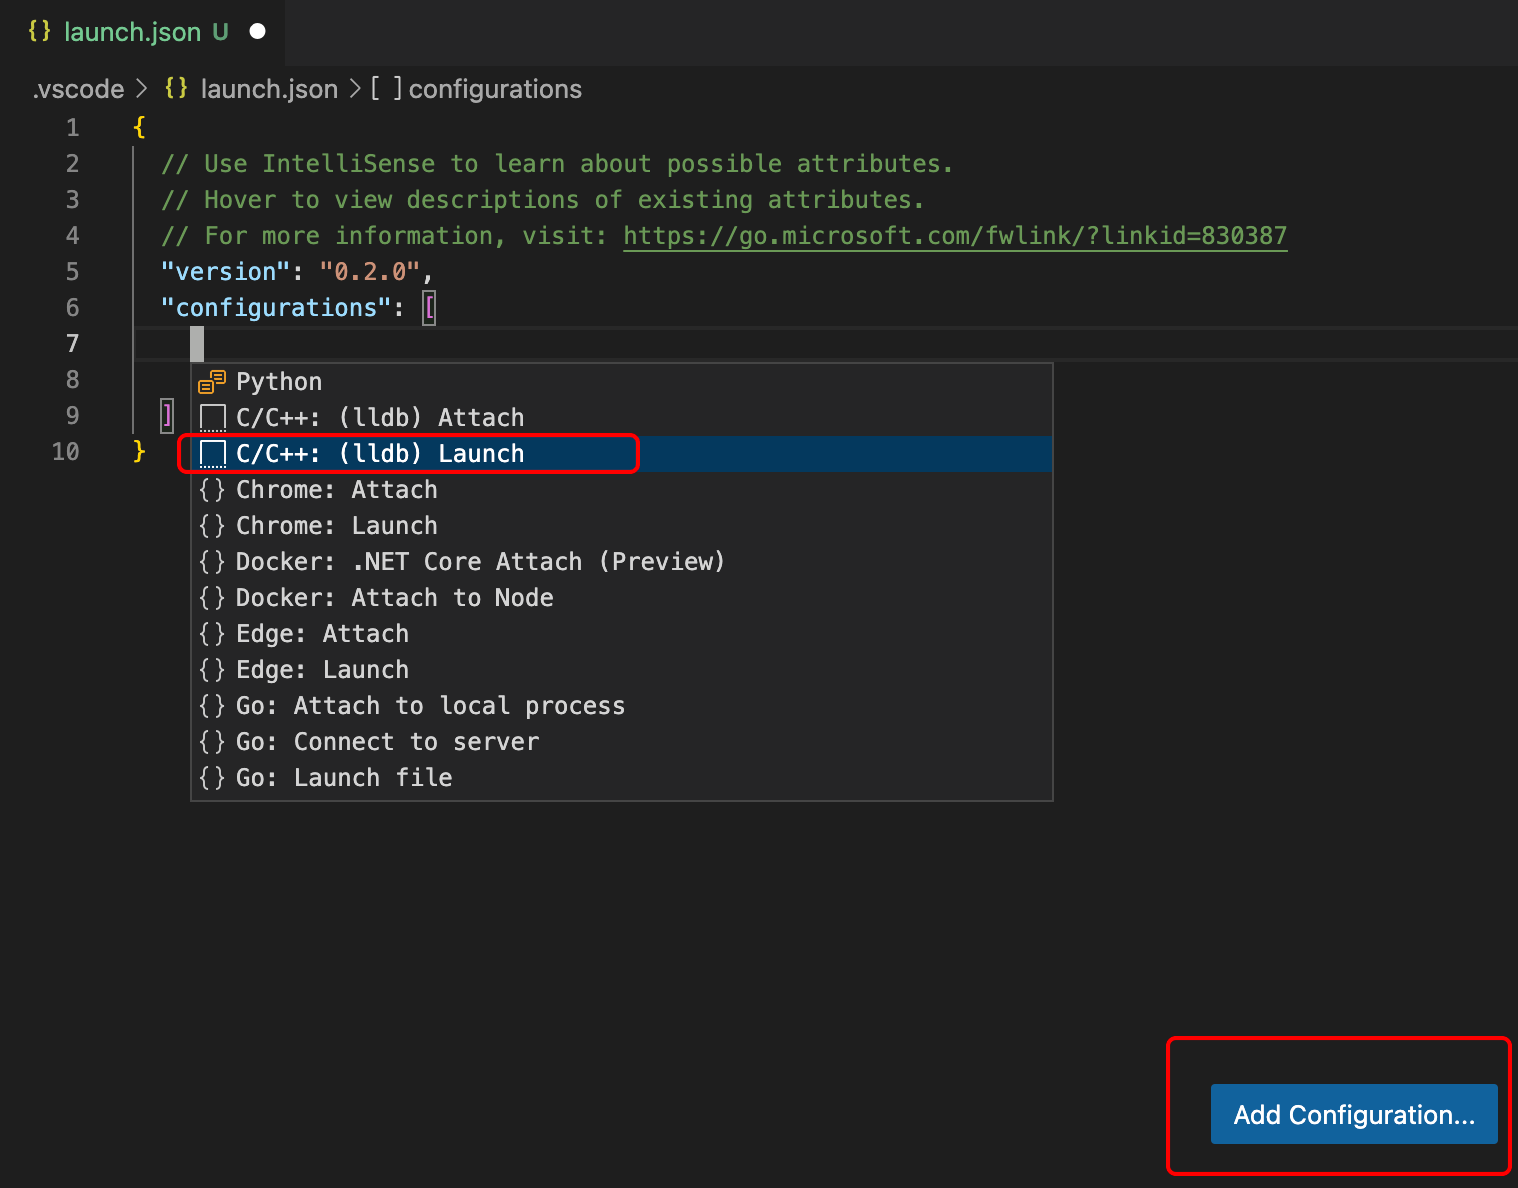
On the open launch.json tab. Click Add Configuration... button on the bottom right. Select C/C++: (lldb) Launch (on Linux, this option may be C/C++: (gdb) Launch).
Change program and args to tell VS Code how to run the program. Note that you should set program to the absolute path of the actual ruby program. A single ruby will probably not work if you are using a ruby version manager such as rvm or rbenv, because the ruby command will refer to a script instead of the ruby binary. You might also want to set cwd to ${workspaceFolder} to let ruby find the lib path correctly. Here is my final setting:
{
  "version": "0.2.0",
  "configurations": [
    {
      "name": "(lldb) Launch",
      "type": "cppdbg",
      "request": "launch",
      "program": "/Users/zyc/.rbenv/versions/2.7.2/bin/ruby",
      "args": ["-Ilib", "-rexample_gem", "-e", "puts ExampleGem::ExampleClass.new.example_plus(2, 3)"],
      "stopAtEntry": false,
      "cwd": "${workspaceFolder}",
      "environment": [],
      "externalConsole": false,
      "MIMode": "lldb"
    }
  ]
}
Everything is set! Let's add a breakpoint to the C code and start debugging.
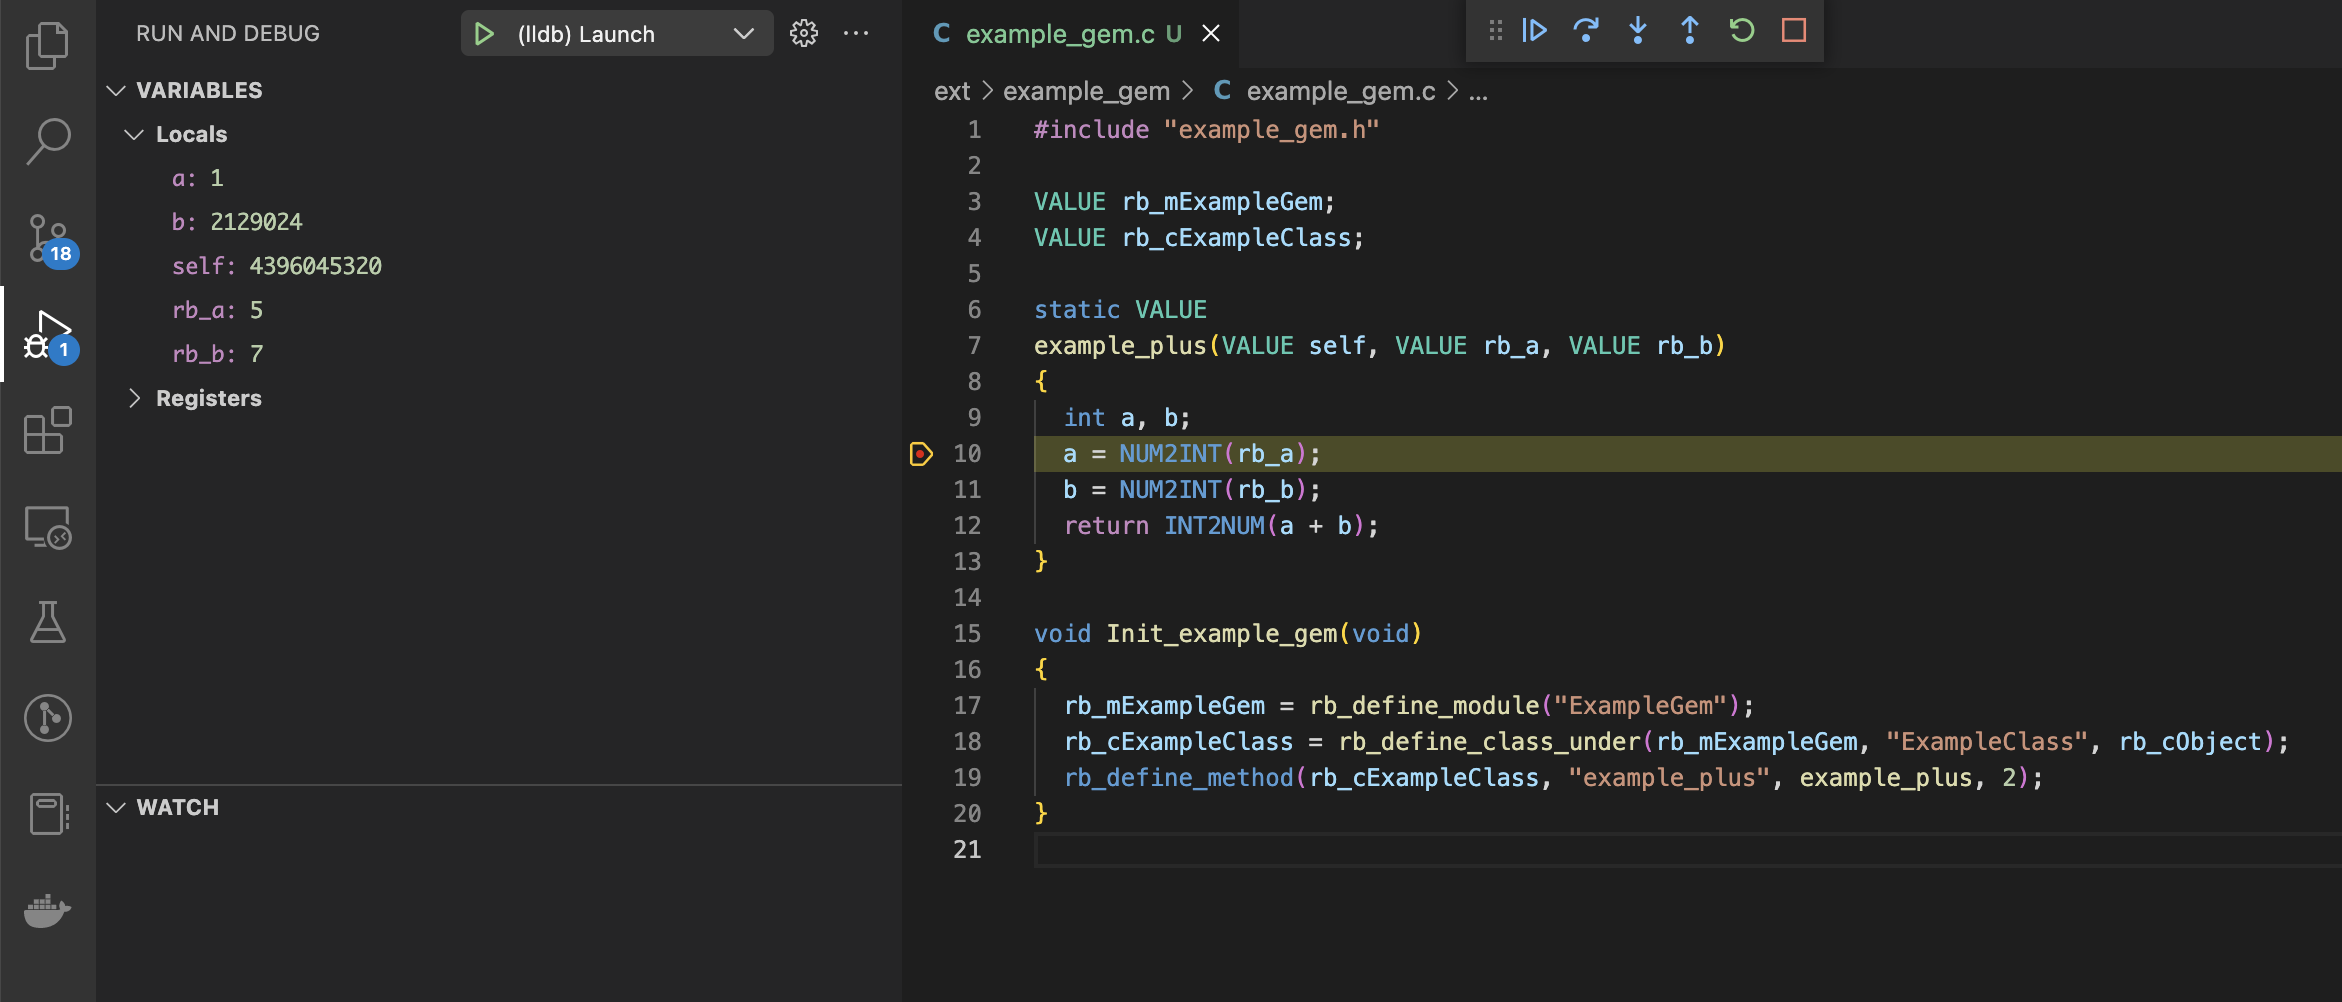
Click on the space left to the line number to add a breakpoint (red dot). And click Start Debugging button.
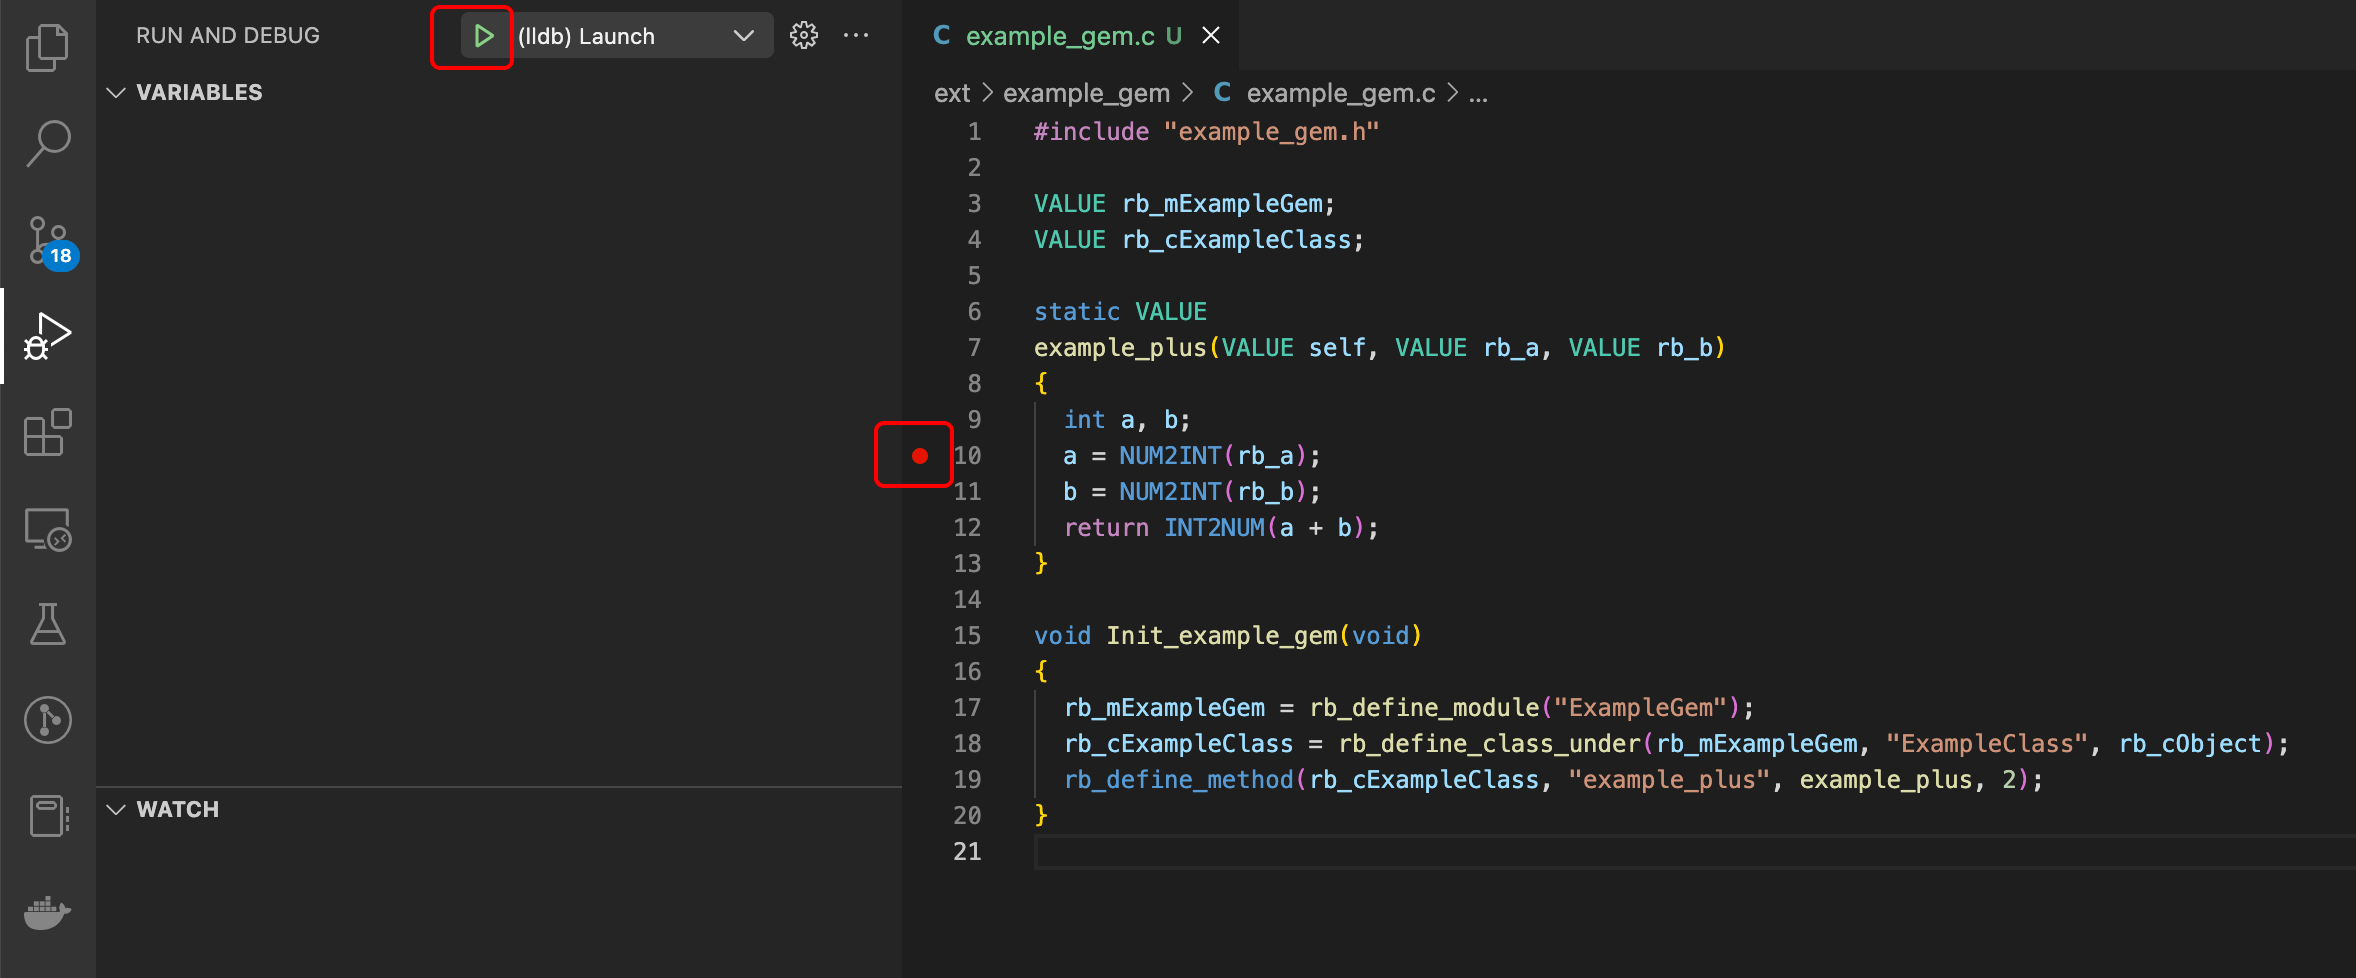
We can see that the code stopped at the breakpoint. The debugging toolbox showed up and you can do all the debugging actions you are familiar with.
Attach to a running process
Sometimes it's not convenient to run the code directly from the raw ruby process. For example, your code must run under Ruby-on-Rails environment, which is not easy to set up manually. Instead of launching ruby, we can attach to a running ruby process and debug from there.
Let's open launch.json again, click the Add Configuration... button on the bottom right, and select C/C++: (lldb) Attach (on Linux, this option may be C/C++: (gdb) Attach), edit the newly inserted JSON configuration:
"configurations": [
{
"name": "(lldb) Attach",
"type": "cppdbg",
"request": "attach",
"program": "/Users/zyc/.rbenv/versions/2.7.2/bin/ruby",
"MIMode": "lldb"
},
...
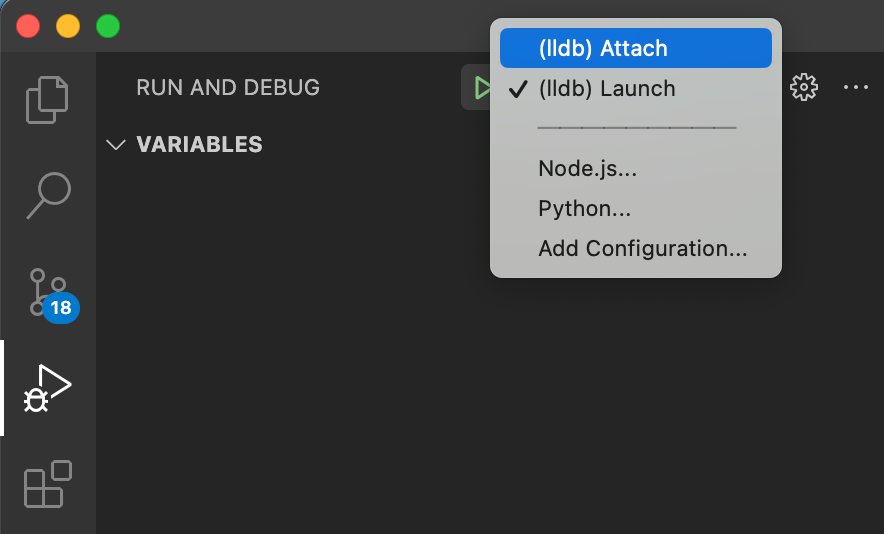
]Now, switch to Attach, start your rails c somewhere, and click Start Debugging
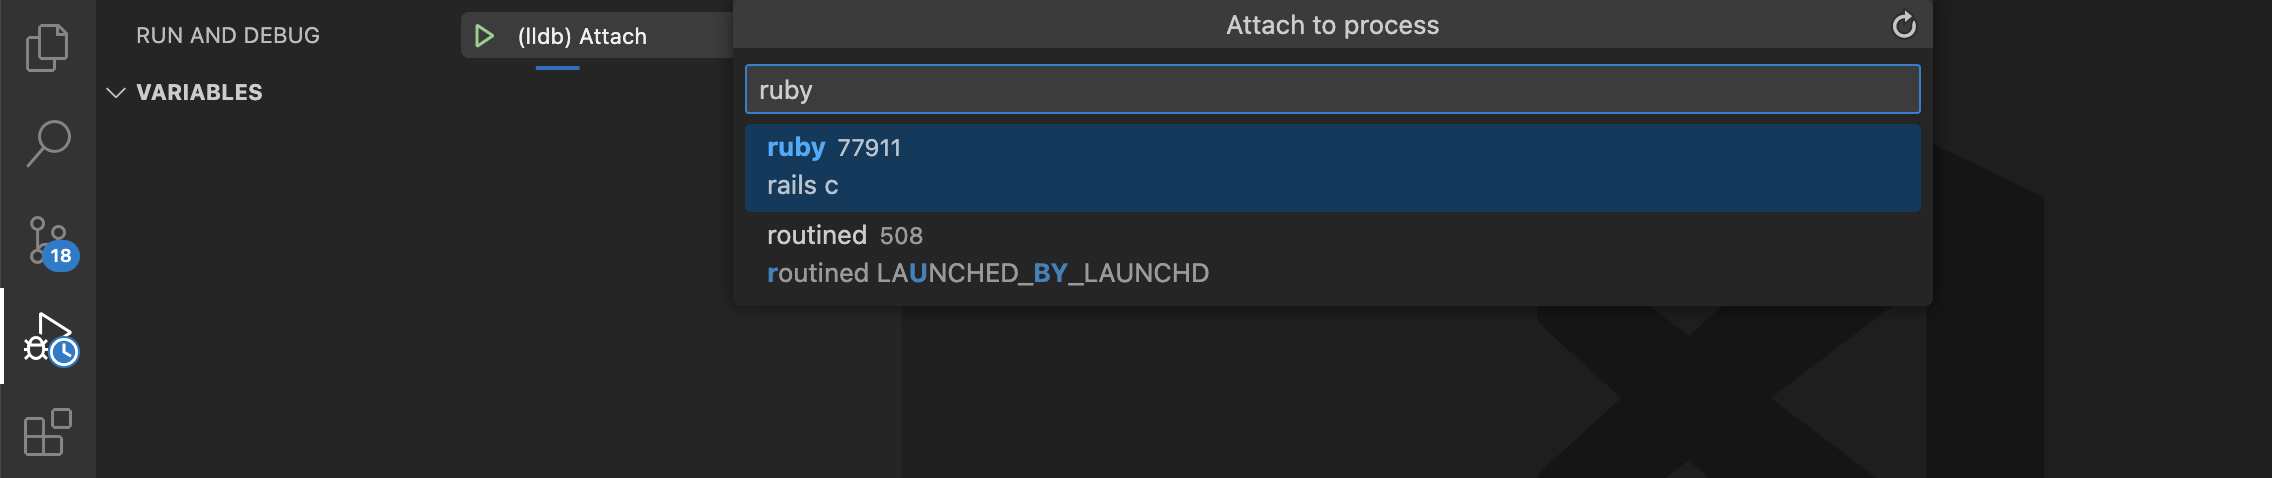
A list will pop up for you to select the target process to attach. Select ruby
Finally, run the code in the Rails console that will trigger the breakpoint, and the rest will be the same as debugging with Launch.
That's all for this tutorial. I hope you find it useful. Happy debugging!